What Your Bank Doesn’t Tell You About Paying Off Debt

thermostat.png

Sunday, 8.40pm

Sheffield, U.K.

Debt is like any other trap, easy enough to get into, but hard enough to get out of. – Josh Billings

I’ve been browsing through Donella H. Meadow’s Thinking in systems and realising that I was completely wrong about things I took for granted.

For example, she talks about what happens when there are two competing things happening at the same time.

The simplest example is the problem you have in winter managing your room temperature.

If you left your house for a week or so with the heating off what would happen?

The heat in the house would flow outside through the windows and gaps until the outside temperature and inside temperature were pretty much the same.

Now, when you get back and don’t want to spend your time shivering, you turn up the thermostat.

This monitors the gap between what you want and what the room temperature is and turns on your radiators until the gap between the setting and the temperature is nothing.

So far so simple.

Now, some of you may have experienced an argument with the others that live in your house that goes something like this.

You want to save money and so keep the thermostat at 20 degrees because that should be enough.

The other people in the house, little and large, disagree and push it up to 25.

I always thought it was reasonable to assume that if the setting was 20 then the room temperature would end up at 20 and then the thing would turn off.

That’s an example of doing the wrong thing because it seems logical – and the problem comes from forgetting about the other loop – the one constantly causing heat to leak out of your house.

You need to figure out how to deal with the losses that are happening at the same time as the gains.

Meadows says that people normally learn to set the thermostat at a higher temperature to get the level of comfort they want – which is why it turns out that I’m wrong and the others are right to do what they’re doing.

Meadows points out that this issue is not really that serious – you can muddle your way through to a solution but it can cause all kinds of problems in other situations – and your bank knows this.

The key point is this – the action you take can only affect the future – and you take action after realising that there is a gap – which happens after some time.

In other words there is a delay between changing the setting and the change in the room temperature (the stock).

The delays in the system are important – and the delays happen from both sides, the thing that causes the stock to increase and the thing that causes it to decrease.

And this is where we come to debt…

Meadows writes, “If you want to pay off your credit card (or the national debt), you have to raise your repayment rate high enough to cover the charges you incur while you’re paying (including interest).”

So that’s something else I’ve been doing wrong.

If you pay for holidays and online purchases on a credit card you might have experienced the shock that comes with paying off a large balance every month.

Even if you’re good and pay it all off it never seems to disappear – it’s like this anchor that’s attached to you every month.

Well, that’s because your credit card purchases take place in a similar way to the thermostat model.

So, I thought I’d try this out – get a year’s worth of credit card expenses and see how the system keeps us in debt.

Well, it turns out that the banks don’t want you to do the modelling.

If I were suspicious, and I am, I’d think that the fact that they provide only three months of transactions to download as a csv suggests they don’t want you to look too closely.

And then, the nature of the csv, which makes sure all numeric fields come in as text and have additional symbols that make it hard to add everything up, suggests that someone is trying to raise the barriers to analysis.

Or am I too cynical?

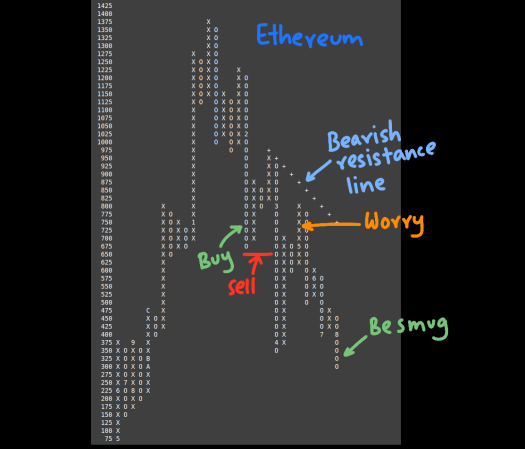
Anyway, the spending pattern that happens is shown in the chart below.

debt-orig.png

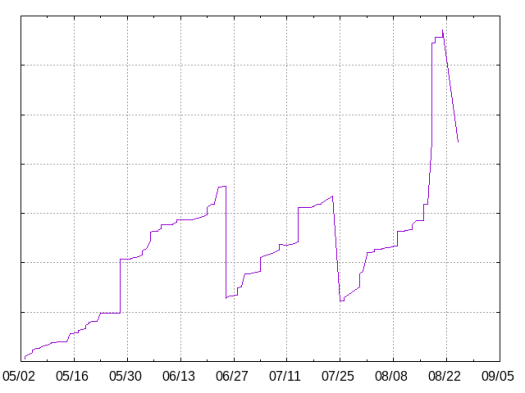
What you’ll see is that although everything is paid off every month (the sharp downward line) the leakage in additional costs over the course of the month means that there is a constant level of debt.

What happens if you pay a little bit extra off every month?

What happens is in this next chart.

debt_test.png

What you see is that your total debt can go to zero – but only if you pay more than you need to.

This is actually a very important point because we spend so much of our time trying to hit targets but if our mental model doesn’t take into account all the factors that matter we won’t reach our goals.

For example, I aim to write every day but I haven’t written for 13 days for a variety of reasons.

Last year out of 365 writing days I managed 251 posts – that’s more than a hundred days that just leaked away.

If you’re trying to lose weight by cutting calories, perhaps instead of targeting 2,000 a day you need to go for 1,800 because there’s going to be leakage.

If you need to raise cash go for $1.2 million rather than $800k.

Now, you might argue, this is just common sense.

Surely this is just setting “stretch goals”?

I’d argue that once you understand the model it’s more than that – it’s realising that you need to look at the whole picture.

Meadows writes, “The human mind seems to focus more easily on stocks than on flows. On top of that, when we do focus on flows, we tend to focus on inflows more easily than on outflows. Therefore, we sometimes miss seeing that we can fill a bathtub not only by increasing the inflow rate, but also by decreasing the outflow rate.”

The thermostat problem seems small – but it’s the essentially the same problem as the issue of climate change.

And no one would argue that’s an easy one to set right.

Cheers,

Karthik Suresh

p.s two interesting links

An example of creating a proper model

MIT’s self study programme on systems dynamics

How To Start Prospecting For Business And Maximise Conversions

venn-diagrams.png

Monday, 10.01pm

Sheffield, U.K.

What can Jack Reacher, the hero of Lee Child’s action series, tell us about prospecting and finding business?

All the core bits, it turns out.

I’ve just been on a family holiday to Copenhagen, one of the nicest cities in the world. Nice – both in terms of the feel of the place and the character of the people who live there. Even when they’re asking you to move out of the way they seem to sing at you rather than bark angrily.

It’s also a hugely expensive city – but somehow seems worth it.

You just get drawn into that cool Scandanavian style of it all – and suddenly spending en enormous amount of money on a cup of tea and a sandwich just seems ok.

On this trip I had the chance to devour a couple of Lee Child books, including “Night School”, where Reacher and a team of other operatives need to find an American who is cutting a deal with a terrorist group, with negotiations taking place in Germany.

They start by looking at the whole population of Americans in Europe. Reacher says “The percentage play would be to start making lists”. Military personnel, civilians, whomever you can find. It’s a percentage play because some people won’t be on records, for example if they drive in through a land border that isn’t recorded.

Perhaps around 200,000 Americans in all. That’s a big number.

Now, compare that to the way in which you might start your prospecting process. It’s much the same. How many companies are out there. In the UK, that’s around 2 million.

How many are large businesses that turn over more than ÂŁ10 million? That’s around 30,000 or so.

How many are smaller ones that make between ÂŁ300k and ÂŁ3 million? You’re looking at around 850,000 companies.

A big list, however you look at it.

Then, you start working through the list, just as Reacher and the team did. They excluded people based on various criteria – if they couldn’t have been in a certain place, for example. They were trying to work down to a small number.

You’re trying to do the same. The difference is that with a list of several hundred thousand, starting at A and dialling is going to cost you – in time or money or both.

That’s the mistake most of us make with prospecting. To start with the assumption that what we do is interesting to a lot of people. That everyone out there is a potential customer.

We need to turn that around and shrink the population we’re working with as much as possible. What’s the characteristic of small populations?

What you do is look for a number of different characteristics. As Reacher goes on to say, “Guys willing to betray their country for money”. Guys willing to do other bad things. “Like a Venn diagram. Not many people where the circles meet.”

That’s the point really. Getting the number of circles right. Too many, and you end up with no one. Too few, and the population is too large. What you want is the right number of circles to come up with a population size that is right for your prospecting engine.

Let’s apply this to a real business process, one that is increasingly applicable in today’s data driven business environment.

One of the areas that I am interested in is data-driven decision making. So, if I wanted to create a business out of this capability as a service, who should I target?

For a start, it makes sense to target businesses that create data. That rules out organisations like hairdressers or garage mechanics. While they promote their businesses through word of mouth and social media they don’t generate the kind of data that requires analysis and processing.

On the other hand, businesses that source a wide range of products and need to manage the associated data, firms that have large number of sensors that record and monitor data and organisations that work in financial or commodity markets are a good fit for what I do.

The next thing is that the businesses I target should currently have highly manual ways of working.

If they’re very technologically savvy, then they don’t need me. It’s the ones that are struggling, that are drowning in a mountain of data that require help.

Another criteria to look at is whether data is a core focus for them. If they sell clothes, for example, the data they create – specifications, sizes, photos – are secondary to their core focus on fashion and trend. The data bit is the messy backdrop to their core business of making people feel great in their clothes.

If, however, they make their living by arbitraging the differences in pricing, then data is a focus and they’ll do this as part of their core business.

Let’s add another circle. How open are they to outsourcing?

If they are the kind of firm that prefers to keep everything in-house and hire their own staff, then you’re going to struggle to get them to engage. Instead, if they see the value in using partners and contractors with specialist expertise, then you’ve got a chance to engage with them.

Creating these circles and looking at them like a Venn diagram gets you clear about what your ideal customer will look like. It doesn’t actually cut down your list – because you might not know some of these things about them – but you do know what kind of customer you want, and that’s a start.

Now, you can design your marketing and advertising to target this kind of customer. When you’re researching prospects, you can prioritise the ones that look like the ideal customer you now have in your head. When you’re talking to them, you can ask questions to find out where they sit in your Venn diagram and keep them in or out.

To succeed you need to focus on the clients that make up the core of your Venn diagram – these are the ones that you have the greatest chance of engaging with and converting to sales. The ones that will fill your pipeline with business.

Going back to Copenhagen, its reputation as an expensive city will put many people off travelling there.

That’s not a problem for the Danes. Some people will save up, just so they can experience the city. Others, who have the money, will go there willingly. It was a big deal for us, but we went because it was a special, one-off experience that we wanted to do.

The ones that turn up, the ones that are in the centre of Copenhagen’s Venn diagram, are the ones that will put money into the city.

And that’s just good business.

Cheers,

Karthik Suresh

ps. As a reminder, this is the eighth post in a series that I’m planning on eventually collecting into a book on Consultative Selling. If you are reading this and are interested in this topic, please let me have any feedback, good or bad, so I can make this as useful and easy to read for you as possible.

What’s Going To Happen To Our Investments After BREXIT?

stock-markets-sep2019.png

Tuesday, 10.35pm

Sheffield, U.K.

It’s probably time to start thinking about markets again.

We’ve had years of plenty. Since the lows of March 2009, where the FTSE fell below 4,000, we’ve had steady increase in its valuation.

And, ten years later, seven months from now, the UK will leave the European Union. What do markets think about that?

It’s a strange thought that there are people in work who started after the financial crisis of 2008. For them, the world has only become better.

For those of us who experienced the crisis, it seems like a long road to recovery and now we ask whether we’re going to encounter potholes, speedbumps – maybe a sinkhole or two. What’s going to happen?

Also, what tools do we have to look at what’s going on and what we can do about it?

For a start, too much information is probably a bad thing.

There’s a study by Paul Slovic looking at the relationship between information and effectiveness in decision making.

No information means you’re just taking a punt – your chances of success are pretty random.

Some information, say 5 -10 pieces, results in a decision that is sort of in sync when it comes to effectiveness and your confidence. Say you’re right 22% of the time based on this information and you’re 20% confident – that’s in line.

Much more information will not radically improve your hit rate – your accuracy. But it will dramatically increase your confidence.

And that’s a problem. More information may well make you more confident – but more because you look for information that confirms your biases than what is actually happening in reality.

I don’t really take in much news. On the rare occasions that I do, I’m not sure that I get anything more than a mass of conflicting opinions masquerading as fair and objective journalism.

Let’s go to where the truth is.

And the truth is in the markets. That’s where people show how they really feel about what’s going on.

Two countries, the U.S and the U.K are both pursuing isolationist policies. How are the markets taking it?

Well, the U.S appears to be taking it well. The S&P 500 is on a steady uptrend.

Perhaps the U.S is fundamentally sound. It’s the largest market in the world, with abundant and cheap natural resources. It’ll do just fine on its own.

The U.K is in a less fortunate position. It’s smaller, cannot dictate terms to its neighbours and can’t rely on support from China or further afield.

Its success depends on how well it negotiates and how well it engages with the rest of the world.

And the politicians so far appear to be doing a pretty poor job of it.

Or so the markets seem to suggest. The FTSE is heading down. Lots of euphoria in May, it seems, with a nice bull run, but since June that’s evaporated and we’re seeing a down trend.

I think this is something to watch carefully. It looks like things have turned.

And not for the better.

Personally, from an asset allocation point of view, I’ve ended up being quite UK light – around 8% in the UK actually and 82% U.S weighted with the rest scattered around the world.

I don’t see anything that’s going to make me change my mind yet.

I’m not looking forward to seven more months of this.

Cheers,

Karthik Suresh

August Update On Cryptocurrency Trading Performance

ethereum-trend.png

Monday, 9.31pm

Sheffield, U.K

An August update… sounds like there was a July, June and May update, doesn’t it?

No, but here’s what’s happened so far… in case you weren’t around and don’t remember the back story.

Last year everyone got very excited about cryptocurrencies.

Bitcoin went up from around $1,000 to over $16,000 by December 2017.

I started looking at it a little more seriously then, pulled along by the euphoric tide that swept the market along.

It’s hard to understand something like that by just looking at it. To really get to grips with you need to engage with the market – make some real decisions with real money.

It’s easy to be an armchair commentator. It’s simple to predict how markets will move and how much money you would have made if you got in at the right time.

But, if you haven’t put your money in and watched it fluctuate, then you haven’t experienced the heart palpitations and emotional reactions that come along with such decisions.

Because, make no mistake, investment decisions are emotional decisions. When it’s your own money on the line, your lizard brain takes over and you either flee in fear or stand and fight with violence.

Back to the story so far… in February 2018 I decide to take a position – buy some Ethereum. That’s the Buy point on the chart.

The chart… well, the chart is called a Point and Figure chart, and it isn’t one that you’ll see often, if at all.

I had a book by Thomas J. Dorsey called “Point & Figure Charting” that explained how to do this. As the book says, this is “the oldest and most completely tested method for technical analysis of stock prices”.

In a world of get-rich-quick merchants, I knew this book was the right one for me when I read the line Tom, ain’t but one way to make money in the stock market. Slowly.

So, before I put a penny in, I built a trading system to manage my risk based on the Point and Figure method. That’s step one. Have a system

The beauty of this method was that I went into my trade knowing when I was going to get out.

As I wrote in my post back in early 2018, I bought in February at around $725, and set a stop-loss at $650.

I sat back as the price went to 875 and 950, cautiously optimistic that I had called the bottom of the market.

Then, in March 2018, the price started crashing off again.

When it went through my stop, I sold. That’s step 2. Follow your system.

And now, it’s several months later, and I’m cautiously optimistic that I got out at the right time.

Yes, the price went down and down and down, then up. In late April and May, I might have been worried that I had panicked early.

But… the chart helps again. There is a line called the bearish resistance line, strong as a stone wall, that the price didn’t breach.

The market was still bearish – and the selling pressure came back and the price has fallen further.

So, one might be excused some smugness at this point. I have no money in the market. But that’s because I made the decision to do that. Not because it’s something that I felt I would have done had I had some money.

The whole crypto space is still a fascinating and evolving space.

But, you would do well to approach it with your rational brain turned on and a system in place to help you make better decisions.

Here be dragons.

Cheers,

Karthik Suresh

How do we know when we’re doing things right?

measuring-impact.png

It’s an inconvenient fact of life that people often want us to account for what we do. Especially when they’re giving us money to do something.

In these situations they’d like us to do something – grow their money, help a community, eradicate a disease – in other words, make an impact of some kind.

They ask, quite reasonably perhaps, that we measure and show what impact we’re having.

Mary Kay Gugerty and Dean Karlan argue that we need to be careful when doing this because we could end up spending more trying to measure things than it’s worth doing – the money could be better spent making an impact.

The problem is that there is lots of data that we can collect. How can we tell what’s worth collecting and what isn’t?

They argue that a good system has the right-fit – giving the people with the money reassurance that the work is having an impact and the people with the responsibility for decisions information that they can act on.

In particular, they say that we need to think about five kinds of data – two that we probably already do, and three that we need to think about some more.

1. Financial information

Most organisations will have some kind of overall financial reporting, if only for tax reasons. They’ll have a profit and loss statement and a balance sheet.

What they might not have is good quality costing that tells them whether they’re spending money wisely or whether certain programs have a better return than others.

When thinking about spending money, being able to work out where it will make the most difference could make the difference between spending wisely or just spending.

2. Activity or implementation information

The second thing we can tell fairly easily is how busy we are. How many tents have been sent out, how many doctors are working in the field or how many servers are in the office.

We can count the busy bees and what they’re doing.

The point is whether what they’re doing is worth doing – does it advance the aims of the organisation?

In some cases, if it’s not worth doing well, it’s not worth doing at all.

3. Targeting information

Then we need to think about whether what we’re doing is helping the right people.

Whether its an aid program or a new computer system – who are the people that will be affected? Is it a large number or will it help a small fraction of a population?

The more we know about who we’re doing something for, the more likely it is we’ll do it right.

4. Engagement information

The next thing to look at is whether people are actually spending time with the thing we’ve put in front of them.

Take mobile apps, for example. The thing that makes an app live or die is whether it gets used.

An interesting experiment on the iPhone is to check the option that says download apps when used. Of the thirty on my screen there are about five I use all the time.

And arguably, all of them could wait till I get to a computer instead of spending my time distracted by the screen.

5. Feedback information

The final thing we need to do is ask people how we’re doing.

Do they like what we do, could we do anything better?

We’ll work harder to deliver better service when we know that we’re going to ask users how we did.

In summary… just collecting data isn’t enough.

Measuring lots of things or creating complicated calculations isn’t going to help.

We’ve got to get better at getting the right kind of information that tells us if we’re on track or way off.

Then, we need to act on what we’ve learned to make things better.

Why we might be thinking about goals all wrong

types-of-goals.png

Goal setting theory has always bothered me – there’s something a little artificial about it – something not entirely natural.

Take the wording in this paper, for example. Edwin Locke and Gary Latham point out that some 400 studies carried out over 25 years show that specific goals lead to better task performance than easy or vague or abstract ones.

This inference hits the target but misses the point.

Before we look at why that is the case, it is useful to note that goals are then split into extrinsic and intrinsic ones.

We try and achieve extrinsic goals to show that we are capable of doing something, or to avoid showing that we are not capable.

We try and achieve intrinsic goals because they give us feelings of mastery and control and satisfaction.

The findings from more studies is that intrinsic goals lead to longer lasting performance.

There seems to be little appreciation, however, about the nature of goals themselves.

A more useful classification of goals, it seems to me, is to think of them as simple or complex.

A simple goal might be something like hit the bulls eye four our of five times on a shooting range. A complex goal might be create a sustainable level of income for a consulting business.

What happens all too often, especially when it comes to an activity like sales, is that we try and set simple goals and targets to achieve a complex outcome.

We’re then surprised and disappointed when the results don’t materialise and get cross and angry and change people.

Perhaps the mistake we’re making is in thinking that all goals are the same and all we need to do is make them SMART – the whole specific, measurable, achievable, realistic and time bound thing that is trotted out in courses.

Instead, we need to recognise the characteristics of the two types of goals and what we need to do to make progress towards them.

Take a simple goal, like getting better at hitting a target with a bow and arrow.

That is a specific goal and can be made SMART.

We can make progress towards the goal by improving how we carry out each step of the sequence of activities needed to achieve goal.

Elite athletes train until their muscles remember what to do and visualise every step they must carry out.

Finally, simple goals have an end point. We achieve them – and then that’s that. There is nothing else we need to do.

Complex goals, on the other hand are vague. They include things like living a good life, having peace of mind, and doing one’s best.

We make progress towards such goals not by following steps but by practising behaviours.

For example, we might try and learn something new every day, talk to a new person, take a different route, try new experiences.

When it comes to tasks like writing or sales, it is well known that having ridiculously low targets is a good way to actually make progress.

Finally, with complex goals there is no obvious end. When do you achieve being good? When is your business sustainable?

There is always change and we will need to adapt and discard less useful behaviours and adopt more useful ones.

Goal setting is a useful exercise. The problem is that we may be trying to adapt goals that are designed for success in fields like sport to life in general.

And life is more complex than that.

How economics explains success in the modern world

modern-economics.png

Steven Landsburg introduced his book “The armchair economist” with the words Most of economics can be summarized in four words: “People respond to incentives.” The rest is commentary.

That is the start of economic analysis. Supply and demand curves. p is for supply, q is for demand and they have a linear relationship.

In standard economics, demand (q) rises as price (p) decreases – and that is one of the first charts we learn in an economics class.

This assumes that people are rational, evaluating the costs and benefits of options in a logical way and taking actions that maximise their profit or utility – the satisfaction we get from a purchase.

But people aren’t rational. In reality, we are driven by emotion and our animal brains and this is where behavioural economics comes in.

For example, under pressure, we go into flight or fight mode and make decisions based on gut instinct – and that is what has kept our species alive.

Another way in which people aren’t rational is how they react to an unfair deal.

Take, for example, a game where people get a sum of money. One person gets to decide the share of the prize – and the other can accept or reject the offer.

In theory, any amount more than zero should be accepted by the rational recipient. In practice, many don’t accept anything less than a share closer to a fair one – a 50/50 split.

Shown as a chart, this might mean that demand is fixed at a range of prices, but over a particular level it increases.

The factors affecting the shift in mentality are more subtle – they are affected by the emotional processing that goes on inside our heads.

Then we have network economics. In this view, what we do depends on what others do – we watch and copy behaviour.

This is most visible in online behaviour. The top three results on Google get virtually all the traffic. There can be huge differences in views for very similar videos.

So, in network economics, price has little effect until we reach a tipping point, after which demand increases rapidly – but the tipping point is determined by the network effect.

The charts in the picture may not describe the situation accurately – real life is more complex than we can show in this way – but the interesting point is the impact it has for the choices we make as producers and consumers.

As producers, we can’t simply make better mousetraps cheaper and expect people to buy them.

Instead, we need to create cheaper products, think about how people will react emotionally to what we are selling and leverage the economics of networks to get our products to scale.

As consumers, we need to be mindful that price is no longer representative of value in many cases – so we need to be wary of using that as a heuristic or rule of thumb.

We also need to realize that producers use increasingly sophisticated techniques to appeal to our emotions, from subtle emotional cues to overt use of celebrity endorsements.

Finally, by copying what everyone else is doing, we may be missing out much that has real value and settling for the fads of the moment.

But, the changing world also offers unparalleled opportunities for those who are positioned where the three economic approaches overlap.

In the middle there, with a little bit of luck, new superstars emerge.

How to do A/B testing

AB-testing.png

What do we do when there are multiple opinions on the best approach to use to tackle a particular problem?

Quite often, we end up going with the HiPPO – the Highest Paid Person’s Opinion, as described in Richard Nisbett’s book Mindware.

But a better way is to use a data-driven approach to testing options and selecting the one that works best.

A/B testing is one of the simplest and oldest methods around.

It’s also called bucket testing or split-run testing, and has been around for a long time.

In essence, it has 5 steps we need to go through.

We start by selecting a situation – we may need to solve a new problem or improve an existing situation.

Take, for example, the issue of GDPR compliance.

Many companies are sending out emails to their lists asking them to confirm if they want to stay on the list and what they want to receive.

What should it say? Perhaps we should come up with a base layout.

Maybe we can start with one that explains GDPR in detail and then asks people to update their details. This is the control.

Should we just send out one email?

That’s not something that can be answered easily because we don’t have any data – do we just need to get a decision from someone?

Or can we run a test?

Say we have a database of a thousand people.

We might create variations of the base layout – instead of explaining GDPR we write one that simply says this email is being sent to comply with the GDPR, perhaps linking to a site that explains what it is, and stresses the benefits of staying in the list and what they will get for most of the copy.

We wouldn’t run the test on the entire database. Instead, we select a sample, perhaps 100 users picked at random out of the list.

Then, we assign users randomly. Of the 100 users in the test sample, 50 will get the control version of the email, and the rest the variation.

Then we look at the responses and analyse results.

This might require some familiarity with statistics and the ability to interpret what a statistically significant difference is and if the variations has performed better than the control.

If the variation performs better than the control, we run with it and send it to the entire list.

In theory, this should produce a better outcome. By testing and selecting options based on how well they have performed according to the data, we should boost results.

We need to remember to retest on a regular basis. Some of our results may be false positives, so we need to watch out for errors or more general changes in the environment.

It’s important to recognise that the aim of this approach is to select the one that gives the user clearer information and a better experience.

It’s also a defensible approach that takes away much of the arguing and opinions that often accompanies choices that involve strategies or the wording of copy.

Instead, we can just offer to run an A/B test and go with the evidence.

Can a bot help us predict financial performance?

text-mining.png

We are bombarded with information every day and don’t have enough capacity to process and analyse it all.

One way we try and simplify is to look at the numbers.

For example, we look at figures and statistics over time – the performance of markets, the change in interest rates, the purchasing managers index and year-on-year comparisons.

Numbers are easier to process, chart and analyse, so we focus on them – but are they telling us the full story?

Are we missing out on what the associated text is saying?

Numbers rarely exist in isolation. They are often accompanied by analysis and commentary in the form of text.

Take annual reports, for example.

New investors look at company annual reports as an accurate and faithful rendering of a company’s performance.

Seasoned investors know that an annual report is the starting point.

It says what the company officers want to say.

The real messages are buried in the text and the numbers have been “managed” to meet expectations.

Is it possible to automate text processing?

This paper by BangRae Lee, Jun-Hwan Park, Leenam Kwon, Young-Ho Moon, YoungHo Shin, GyuSeok Kim, and Han-joon Kim analyses the relationship between business text patterns and financial performance in corporate data.

Specifically, they use annual reports of US listed companies in 10-K format that report on financial performance, the state of the business, competitiveness and the risks the companies face in their industry.

These reports talk about the past. What can text analysis tell us about the future?

Text mining is a way to process and extract insights from text

Text mining techniques process text and analyse it using descriptive statistics, clustering and sentiment analysis.

For example, the length of text in company annual reports can be expressed in terms of the number of sentences, the number of words and the number of words per sentence.

Clustering involves grouping companies that have similar statistics and then comparing their performance.

For example, we could use their average compound annual growth rate (CAGR) and compare that with another set of companies.

Finally, sentiment analysis looks at how positive, negative or neutral the text is – a way of measuring the subjective content and tone of text.

Does it work?

It’s still early days for this kind of technology but some interesting things are pointed out in the paper.

Companies with good performance talk about products, services, users and business, while those with poor performance talk about the government, contracts, results and the future.

It’s possible that companies that do well write more – longer sentences and more words about how they are doing.

Finally – and an interesting result – the tone of the text has no relationship with sales performance.

The takeaway is – don’t get sucked in if the company officers predict good times ahead, or if they are pessimistic about things.

That says more about them than the company.

It’s possible that text mining techniques will help us make better forecasts as we continue to use and refine them.

Why I sold my crypto holdings

ethereum-mar-2018.png

Like many other people, crypto currencies weren’t really something I looked at seriously until the staggering rise in their valuations in 2017.

In December and January, the price of Ethereum went from under $500 to over $1,250, more than doubling in two months.

The entire world got very excited.

Everyone seemed to be looking at these currencies and talking about buying it.

Was crypto something I should get into as well?

Buying a crypto currency is not like buying a stock or an index fund.

With a stock, we are taking an ownership stake in a company, with underlying cash flows and the possibility of growth and more income over time.

As an owner, we share in the growth (or not) of the business – and it makes sense to buy good businesses and hold them over time.

An index fund that covers a market is taking a position that an entire economy will grow and we will share in that.

For example, a S&P tracker will simply follow the performance of the largest companies, and they will probably be worth more in 20 years than now.

Cryptos are a pure trading play

Currencies don’t work like that – they have no intrinsic value.

They are worth what someone else is willing to pay for them in another currency.

That means we need to understand how buyers and sellers in that market work.

I needed a trading method

In many situations, we only need to be good at the buy side.

We’re going to buy and hold for the long term – and as an investment method that works quite well for things like buying stocks or making decisions on commodities like electricity and gas that we actually need for our homes and businesses.

In trading, however, we need to be good at the sell side as well.

More than good actually.

Lets say that we are 70% right at picking when to buy. That seems good, right?

If we are also 70% right at picking when to sell, then for any trade that involves a buy and sell, our probability of success is 0.7 x 0.7 = 49%.

That means we have a less than 50% chance of being right over time on both elements.

That’s where a system comes in, so my first step was to code one up to use for crypto currencies and I decided to apply point and figure charting (P&F).

A P&F system is designed for long term traders that want to understand how buyers and sellers are operating and make decisions on taking positions in that market.

The picture above is a snapshot of my P&F chart for Ethereum.

A position with actual money makes it more real

It’s easy to talk about what we would do, but to really get a feel for how we will act in a trading situation, it’s necessary to put down real money.

After the fall in value in February 2018, I entered the market with a very small position on the first reversal – marked as BUY on the chart.

I bought at around $725, and set a stop-loss at $650 – the red line.

The price went up a bit, down a bit, up a bit and then started to come off consistently during late February and into March.

When it crashed through my stop – I sold.

There isn’t much point having a trading system if you don’t stick to it

The point is that my sell wasn’t due to market conditions or timing or emotional decision making.

At the time I bought, I had a sell in mind, both for the upside and the downside.

This was a trading play, not an investment one – so when it went against me, the only rational thing to do was cut my losses and stop playing.

The next thing to answer is – when should I enter the market again and have another go?

%d bloggers like this: