How to analyse a dataset

data-analysis.png

When we say we analyse data, what do we actually mean?

For many, it means looking at rows and columns in a spreadsheet, with a sense of quiet desperation.

So, where should we start.

The American Institute of Certified Public Accountants (AICPA) defines data analytics (in the context of audits) as “The science and art of discovering and analyzing patterns, identifying anomalies and extracting other useful information in data underlying or related to the subject matter of an audit through analysis, modeling and visualization for the purpose of planning or performing the audit.”

That’s probably as good a place as any.

The first thing we try and do when looking at a dataset is to figure out where to look more closely.

We’re trying to take a journey from data to insight – and that involves a few steps.

Take patterns, for example. Patterns tell us that something happens regularly – and so help us predict the future.

For example, a heatmap of energy use in a building that consistently shows hot spots of high energy usage outside normal working hours is a pattern worth looking at more closely.

The human brain is wired to detect patterns – but sometimes we can fool ourselves into thinking a pattern exists and then convince ourselves by selecting only evidence that confirms our belief.

But, that’s where computers come in, and the ability to visualize and run a correlation analysis should help sort that out.

Once we have an expected pattern, then we have something to compare against when looking at new data values in the future.

Then there are deviations.

Most things – and their associated data points – fluctuate.

They go up and down – sometimes up for a while and sometimes the other way.

Our task is to figure out which movements are significant.

And we can do that by using methods like control charts – where we work out where we expect values to be most of the time and call out the ones that go out of the bands we have set.

Finally, there are outliers.

These are the data points that are simply different from everything else.

They could just be wrong, or they could point to a major problem.

For example, it could be a sign of fraud, or a breakdown of equipment.

A thematic review of audit quality by the UK’s Financial Reporting Council (FRC) finds that a lot of firms talk about their use of data analytics in auditing financial statements.

Not many, however, have the in-house capability to get and process data in this way.

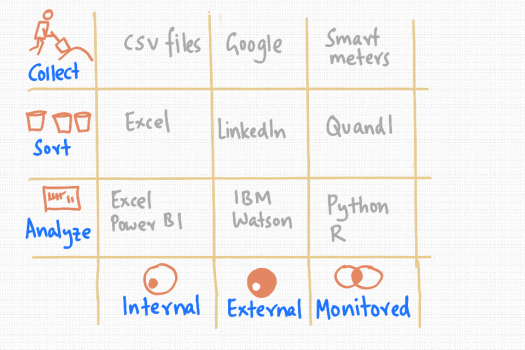
It seems that it makes a lot more sense to have a centralised team that can provide this kind specialised IT capability – from extracting data from other systems, getting it into the right format and carrying out the necessary analysis.

One point to note is that some companies offshore this kind of data capture and analysis – which may become an issue as more governments create controls over data governance, security and privacy.

On a practical basis, however, if we have tools and processes that can analyze patterns, deviations and anomalies or outliers, we’re off to a good start.

How many data-driven business models can you come up with?

data-driven-business-models.png

We’re all aware of big data – the ever expanding collection of data points around us.

The data dump piles up daily.

From the tens of thousands of photographs we have to social media postings, from smart meters monitoring electricity usage to databases full of supply chain variables – the amount of stuff around us just keeps increasing.

Which creates new business models and opportunities for old and new firms.

In a working paper published by the University of Cambridge, Josh Brownlow, Mohamed Zaki, Andy Neely, and Florian Urmetzer put forward a framework to think about data driven business models.

They suggested that we need to ask ourselves six questions:

  1. What do we want to achieve?
  2. What is our offer?
  3. What data do we need and how are we going to get it?
  4. How are we going to process and use the data?
  5. Where is the money?
  6. What’s in our way?

The team also put forward a taxonomy to help classify data-driven business models.

An adapted form of this is shown in the picture above, to help see what products, organisations and solutions are already in this space.

So, data comes from broadly three places.

Internal data is generated by individuals and companies.

External data is broadly everything that we haven’t created.

Monitored data is collected and processed in a planned way – like website analytics or electricity metering data.

With data – we need to do three things to turn it into insight and decision support material.

We need to collect it, sort it in some way and then analyze it.

This classification system gives us a way to start thinking about business models in this space.

Also, clearly, models will overlap and some firms will do more than one thing.

So, for example, lots of data sits in comma separated value (csv) files. While we’d like to think databases are everywhere, the csv format is still very useful.

Many companies rely on Microsoft Excel to process their data – most people know how to use it after all.

The gorilla in the room when it comes to collecting information that is out there is Google.

On the other hand, when we want to find someone in business, LinkedIn is probably the place to go. It’s sorted everyone’s professional information rather well.

Now, lets say we want to analyze twitter feeds – IBM’s Watson has a suite of services that might allow us to do that.

Then there is the data we collect on purpose.

Like electricity smart metering – that’s rolling out in households in the UK – which is 20 million more places to read data from.

When it comes to market price data of all kinds, Quandl provides a convenient way to pick up feeds.

Finally, to analyze all this data, tools like Python and R come into their own – as scripting languages that can cope with the size and complexity of analytical needs.

So, the next time we’re thinking of a data-as-a-service type opportunity, this classification may be a useful one to keep in mind.

Could reality get too dull for us?

hyper-reality.png

We spend an increasing amount of time in front of screens.

Some are fixed – our TVs, computer monitors. And some are with us all the time – our mobile phones.

A future where our screens can be in front of us all the time is not too far away.

Cher Tan, in an article on placenessness – a world where we can have the same coffee anywhere in the world – draws our attention to Keiichi Matsuda’s film Hyper Reality, a vision of this kind of future.

In this new world, we layer experiences on top of reality.

We start with questions – and questions these days for most people are synonymous with Google.

The thing is that many of the important questions we have, like who am I? and where am I going? are answered quite literally by Google – with name, rank and serial number, and a point on a street map.

It answers the question but misses the point.

Then there is the constant backdrop of what we do with our time.

Many of us play games – and we can do this all the time – on the bus, while walking, during work…

There is also useful stuff – like instructions on where things are, when to stay out of the road, where the nearest emergency centre might be.

When something is wrong, we can speak to someone.

Or something anyway.

Lifelike chatbots can have a conversation with us and help us with any problem we have.

Until they stop working and the system needs to be restarted.

In this world we’re surrounded by information, from how much things cost to how much money we have left.

Although money might be an old fashioned thing by then – we might be much more focused on points, how many we have, how much we can get with them, whether they are safe.

In Hyper Reality, the biggest feeling is one of sensory overload.

It’s like having the lights and action of Times Square superimposed on the daily activities of life – getting on the bus, going shopping.

And, when the lights go out for a second, reality seems rather underwhelming.

Probably much like the feeling we have when we’re stuck on a train without a book and our mobile phone battery runs out.

We want the lights and action back on again.

It’s a relief when the system starts up and we have the screens up and running.

The thing is – in this world we could go days without having to speak to anyone real.

We could be totally connected and yet be completely alone – we need the virtual world because reality is just too crushingly dull.

Could this be a possible future for many?

How ethically are people likely to act?

10-40-40-10-rule-of-ethical-behaviour.png

What makes people act the way they do?

Is it the organisational culture around them? The people in their team? Their own values?

The 10/40/40/10 principle suggests that in any group 10% will take advantage if they see the risks as being low.

40% will go along with the group.

40% will try and figure out what the organisation is trying to achieve and do it.

10% will push for their personal beliefs and values.

This breakdown is apparently based on Lockheed Martin research, but it’s not clear whether there are any substantive studies that confirm this – it might just be a convenient rule of thumb that matches the 80/20 principle.

The point is that people are complicated – and the situation they are in will influence how they act.

For example, once we know that this is the expected breakdown, will we do the same as before?

Is it possible that awareness might cause us to change the decisions we take?

Or take a thought experiment.

Let’s say we’re in a ship that ran into trouble and everyone had to abandon ship and get into lifeboats.

We’re in the boat with six others and there is still one person in the water.

The leader says that as all of us are now in, and there is enough food and water for the group, the best option is to leave the last person in the water.

That way all of us can survive.

What would you do?

Perhaps we’d like to think that we’d stand up to the leader and insist on helping.

Or we might follow the group.

But many would be appalled at the idea of leaving one struggling person in the water.

But, when we take that principle up a few levels, to the question of a country and how it treats refugees, how do our thoughts and actions change?

What is clear is that as a species, humans are biologically and socially inclined to go with the group – for better or worse.

Which makes it all the more important for individuals to try and have a mind of their own.

How to expect the unexpected

unintended-consequences.png

History is littered with examples of when well intended action has resulted in unexpected outcomes.

Steven Levitt and Stephen Dubner in Superfreakononics write about the General Hospital in Vienna, where in the 1840s, women in labour where more than three times as likely to die in hospital than at home with a midwife.

It turned out that the doctors – who were trying to save their patients – were actually transferring germs to them because they were examining them without first washing their hands.

A simple fix – washing their hands – put an end to the deaths.

Politicians are forever coming up with programmes to incentivise changes in behaviour.

Often, however, things don’t go the way they expect.

For example, subsidies for wind power around the world have, quite literally, led to a windfall for landowners who have large tracts of property in windy areas.

People who are probably already relatively wealthy have been offered guaranteed subsidies for many years to site turbines on their land.

People who don’t have access to land or utility connections face relatively higher costs.

And the poorest, who have no way of reducing their costs or investing in their own generation systems face the prospect of increased bills to pay for the subsidies for the wealthy.

This happens again and again in different situations.

Levitt and Dubner put forward examples where laws aimed at preventing discrimination result in increasing it, or laws aimed at reducing waste result in more illegal waste dumping.

And, when it comes to things like tax codes, there are entire industries devoted to figuring out and working within loopholes.

So, how can we improve the way in which we plan actions and deal with outcomes?

The systems around us are complex and any intervention is likely to work through feedback loops rather than a simple cause and effect approach.

In addition to the intended result, we need to think about what we will do if the outcome results in a windfall, a detriment or a perverse result.

In essence, we need to make sure we model more than just one scenario.

What makes an innovation likely to succeed?

innovation-diffusion.png

When we try and create something new, whether for a new startup or as a new product line in an existing company, what questions should we ask ourselves to increase our chances of success?

Everett Rogers, an eminent sociologist, came up with the diffusion of innovations theory that tried to show how ideas and innovations spread through societies.

He argued that there were five characteristics that people looked for when considering a new product – in essence asking themselves five questions.

1. Relative Advantage

People start by looking for relative advantage.

Is it better in some way than what we are doing now?

Does it help us do something faster or make it easier to do a complex task?

2. Compatibility

Many innovations aren’t adopted simply because they aren’t compatible with existing systems and processes.

One of the reasons Software as a Service (SAAS) appeals to people is because all you need to get started is a web browser.

There is no need to get IT involved and get permission to install new software, or worry about which operating system or hardware drivers are needed.

3. Complexity

If something is seen as too complex or too hard to do, people will be put off.

When a product needs extensive training before it can be fully used, then the chances of widespread adoption start to fall.

These days, if something needs to ship with a manual it’s probably too complicated.

4. Observability

Are the pros and cons of the innovation clear to anyone looking?

Quite often, we still work through a list of positives and negatives when considering a purchase.

Decision makers want to be able to see clearly what return they will get on an investment – a fuzzy set of benefits will probably make them nervous and less willing to commit.

5. Trialability

Can we try before we buy?

This is almost a given for most organisations now.

Very few companies have the reputation and market dominance to simply put an innovation out there and expect customers to buy it.

Most need to provide a trial or pilot period where customers can test and use the innovation before signing up for a contract.

6. Social and legal considerations

A sixth point, and one that is increasingly important, is around the social and legal aspects of the innovation.

Socially responsible products and businesses are likely to be preferred by buyers that are looking for a long term partnership.

And modern technology creates new legal challenges – for example, it’s easier to take pictures but which ones are legally acceptable to share on social networks?

Summary

In summary, if we can say yes to these six questions, we should increase our changes of succeeding with a new idea, innovation or product.

Do you have what it takes to be a hacker?

hacking-characteristics.png

A hacker, in the eyes of many, is a criminal – someone who breaks into computer systems and steals information or worse.

Real hackers, however, don’t see things that way.

They call criminals “crackers”. Hacking is something much more creative.

Too many of us are bound by the rules, the way things are done and have always been done.

This is why we spend time entering data into mind-numbing spreadsheets, making cold calls, going into a physical office every day and following processes laid down by administrators.

That’s business as usual.

A hack is simply a cool new way to do something.

It’s that shortcut we figured out, a piece of code that can take something that takes 2 weeks to do at the moment and gets it done in 2 minutes, the one change in our daily routine that saves us an hour of effort.

The main characteristics of a hack are that it is simple – almost obvious in retrospect, and masterful – something that bubbled up from all the expertise and work we had already put in.

It is also illicit – it doesn’t follow the rules set out by the system.

Just because managers have said something should be done in this way doesn’t mean it’s the best way to do something.

If we all accepted the status quo all the time, there would be no innovation, nothing would change.

One of the greatest “hackers” of all time, Richard Stallman, would never have built his free software and associated free software license that went on to transform the world of computing, creating a real alternative to the corporate giants – Microsoft and Apple.

Sometimes, to do something better, we have to ignore imposed rules – and act illicitly.

The problem, of course, is when this turns into illegal activity – and that’s what worries the general public.

The idea of hacking – the good way – is behind sites such as lifehacker, that provides tips and tricks for getting things done, or the concept of growth hacking – unconventional ways to acquire customers and rapidly grow a company.

In today’s technology dominated economy – innovation comes from looking at things differently and coming up with simple and masterful ideas that transcends conventional wisdom and conventional rules.

The hackers in the machine are the ones doing innovative things and creating value – whether it’s in software, business systems, marketing or operations.

Being a hacker, in essence, can make what we do more interesting.

How to set up a knowledge work space

5S-method.png

The 5S method is a way to organise work spaces in manufacturing – and is a core part of the concept of lean.

It uses 5 Japanese words: seiri, seiton, seiso, seiketsu and shitsuke. They can be translated as sort, set in order, shine, standardise and sustain.

It’s easy to see that having an organised workspace makes a difference in physical work.

But what about knowledge work? Can it be used there as well?

Bradley Staats, David Brunner and David Upton looked at whether lean principles could be embedded into a software company.

Staats and Upton write in the Harvard Business Review that lean projects don’t necessarily produce better quality work but do come in on time and under budget.

Knowledge work has specific aspects that make it different from manufacturing, such as uncertainty over the tasks that need doing, the fact that a lot of knowledge may be inside people’s heads as tacit understanding and that how things are done may change during the projects as requirements evolve.

In manufacturing, we usually know what we need to do, how to do it and in what order we should do it.

An assembly line designed to make cars doesn’t usually end up producing pizzas. But that seems to happen quite often in knowledge work.

So, how might we apply 5S in knowledge work?

Sort is all about removing obstacles. It means getting rid of piles of paper, books that we are never going to read and clutter that gets in the way.

The things that are in front of us or on our desks should be the things that we use every day. Everything else should either be discarded or be put somewhere where we can get them when we need them.

Set in order is then about arranging things in the way that makes it most efficient for us to use them.

For example, if you are right handed and your office phone is on your right side, the chances are that you’ll pick up the phone in your right hand, and then move it to your left to take a note.

When you put the phone down, it will probably introduce a kink into the cord – and that’s why so many office phones have such twisted wires.

Putting the phone on the left should sort this out.

Shine is about keeping our desks and workspaces clean.

Standardise is about doing things in a particular way – that’s crucial in manufacturing so that variation is minimised and everything comes out the same.

In knowledge work this is sometimes taken to mean that everything should be documented and made explicit so that people can follow a set of instructions and do things.

This is something I disagree with. If you can make something into a procedure then it should also be possible to automate it and remove the human element.

Instead, standardise in the context of knowledge work should be more about getting ourselves in the right frame of mind to do creative and innovative work.

We should aim to set ourselves up to get into flow with what we are doing, so standardisation should really mean things like checking email at set times, doing timed pieces of work, creating spaces for deep work without interruption and so on.

Finally sustain is about what we do every day.

Because knowledge work is so intangible, it’s easy to get bogged down in day-to-day firefighting and forget that we also need to innovate and create.

And that takes time and energy.

Which we might be able to create if we use the 5S method to address the things around us getting in the way and grabbing our attention.

Humanity as a service: The future of work for us

robot-human-work.png

We work with computers now – that just seems natural.

Many people have jobs that involve using a computer at some point – it’s hard to think of many occupations that don’t.

Thirty years ago – that would have been unthinkable. Fifty years ago, people would still have scoffed at the idea of individuals owning computers.

The way in which we produce work and output in the future is inevitably going to involve technology.

Which means we should ask ourselves where we might fit in?

Robots – AI – all the tech we have – are still essentially logic circuits. They do things they are programmed to do.

If we could take the knowledge inside a doctor’s head, a lawyer’s head and turn it into a series of steps that could be done by a computer using a decision tree, then we’d be able to free up some of that professional’s time.

In many offices, there is someone given the task of comparing columns of figures and picking out the ones that don’t match.

If anyone is still doing that by eye – they need to get more skills – and quickly.

We’re not going to beat robots at tasks that involve calculation or large amounts of numbers.

We will be able to automate them to perform certain tasks – from doing our accounts to managing our heating.

Many systems come with this technology increasingly built in.

NEST can warm your building when it knows you’re coming home. Landrovers warm up your car in the morning ready to go to work.

So, what does that leave humans to do?

What’s left are essentially human tasks.

Things like being creative, using our judgement, having empathy and doing critical thinking.

Some of us will also be needed to clean and maintain the robots that do all the work.

But increasingly, we’ll spend our time doing work that comes up with new and better things and helps others – especially in ageing economies.

In other words – we need to shift to providing humanity as a service.

How to build something that is actually useful

lean-canvas-example.png

What should we do when we’re trying to start something new – whether it’s a new product line within an existing business or a startup dedicated to the idea?

All too often, we can come up with ideas for products and services and go quite far down the track of designing and creating them before finding out that the market isn’t that interested.

Alexander Osterwalder came up with the Business Model Canvas – a way to model a business using a one page framework.

This was much simpler than writing a 50-page business plan, and was enthusiastically adopted by the startup community.

A variant of the model by Ash Maurya is the Lean Canvas.

While the Business Model Canvas is designed to address all aspects of a business, the Lean Canvas focuses specifically on new product development.

The Lean Canvas retains five components of the Business Model Canvas:

  • Value proposition: What does the customer get?
  • Customer segments: Who is going to want this product?
  • Channels: How are we going to get to speak to them?
  • Revenue streams: What will they be willing to pay?
  • Cost structure: What will it cost us to deliver the product or service?

It adds four new components.

First – what is the problem we are trying to solve for a customer?

As Theodore Levitt said, People don’t want to buy a quarter-inch drill, they want a quarter-inch hole.

If the product doesn’t address a real problem that potential customers have then it’s hard to justify its purchase.

Then, what is the solution we are proposing?

The solutions needs to be simple – easy to understand. That doesn’t mean it has to be easy to do – or the customer could just do it themselves.

It must be possible, however, to see how the solution solves the problem.

We then need to look at two more components – metrics and unfair advantage.

Success or failure needs to be measured in an objective way and for that we need to select metrics.

Selecting a metric directly influences the activities we do in order to improve our score on that metric – so it’s important to select a few and important ones.

Finally, there isn’t much point spending time and money developing a solution if it can be easily copied or bought from someone else.

We have a competitive advantage only when it is hard for others to compete with us.

So, in summary, in order to build something useful, we need to start with a customer’s problems, come up with a solution, make sure we are doing the right things, and make sure that what we do is unique to us.

An easy list to write – but not a simple one to do.

%d bloggers like this: