How to pitch your idea

6-pitches.png

The author Dan Pink writes that we are all in the business of moving others now in his book To Sell is Human.

Whether it’s persuading others to back an idea or strategy to what people think of as traditional sales, all of us are increasingly required to pitch our ideas and get support in order to do anything.

The test for whether an idea was clear was the elevator pitch. Could you succinctly sum it up in 30 seconds or less as you went up an elevator with someone important.

But… we rarely share lifts with important people any more. What do you do when you don’t have an elevator available and you want to get their attention and spark interest?

Dan Pink describes six successors to the elevator pitch. It might help to remember them as you look at the symbols on your keyboard that match the ones in the picture.

1. ! The one word pitch

Can you describe your idea in one word?

Pink suggests starting with a short description, say 50 words. Cut it down to 25. Cut again to 10. One of those that is left is the one word that describes what you do.

For example, the website of Patek Philippe, the luxury watch brand, has the word Aesthetic scrolling on its homepage.

In an interesting twist, they have the one word that they feel describes the beauty of their product in several languages.

2. ? The question pitch

If you are sure of your facts and logic, then asking a question is a powerful way to get started.

WaterAid, a charity that helps bring clean water and toilets to people who lack basic sanitary provisons around the world, simply asks Are you ready? on their website.

Then they explain their goals and how you can get involved.

3. = The rhyme pitch

A rhyme sticks in your mind.

Pink says that if you are in competition with others, coming up with a rhyme that summarises what you do will help people remember your firm and potentially give you an advantage.

4. @ The tweet

Can you summarise what you do in less than 140 characters?

Apple is a company that mastered this approach with short, snappy lines under Steve Jobs.

“1,000 songs in your pocket” and “The world’s thinnest notebook” still probably bring to mind the iPod and the Mac Air.

5. _ The subject line

Email is still where most of us live, and where we get the most junk.

To stand out, your email must do at least one of two things, and preferably both, according to Pink.

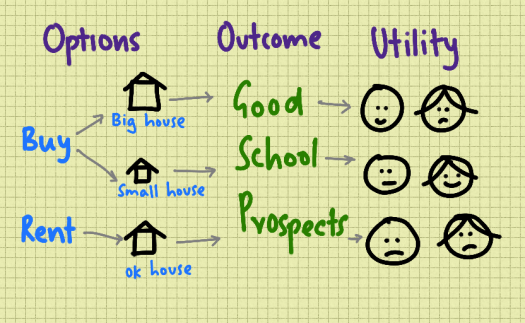
It must have utility – a clear statement of whats in it for the reader.

It must spark curiosity – a desire to learn more.

6. ” “ The story pitch

The story pitch, also called the Pixar pitch, says that every Pixar pitch has the same formula:

  • Once upon a time…
  • Evey day…
  • One day …
  • Because of that, …
  • Because of that, …
  • Until finally, …

Pink’s site has a few videos that also explain these in more detail – and the book is a pretty good read as well.

The next time you’re stuck for a way to craft your pitch, just look down at your keyboard and remember the six new options you now have.

!?=@_” “

The 5-stage thinking framework – TOLOPOSOGO

5-thinking-stages.png

How should we approach a problem, think of solutions and take action?

We have a number of biases that affect us when trying to solve problems.

We might jump to a conclusion too quickly, select facts that confirm what we believe is true or allow the power balance within a group to control the direction we take.

One way to structure how we think is to use a framework developed by de Bono, which uses the mnemonic TOLOPOSOGO.

It has 5 stages.

1. TO where are we going?

First, think about the end result.

What are we trying to solve. Where do we want to end up?

Having an idea of the outcome can help keep us focused.

2. LOok at the facts.

What data do we have? What are our assumptions?

This is where we set out the information we have and consider it – analyzing and evaluating what it says and means.

This is where we need to be careful not to select facts that support our views and discard others that don’t.

We need to stay open and fit all the facts into the ideas and theories we have.

3. Think through the POssibilities.

Once we have the facts, we need to think of the possibilities – come up with options and alternatives. This is a creative, idea-generating process.

It also needs to be a provocative process – challenging existing thinking and seeing how we can do things differently.

In the picture, the mnemonic makes a right angle turn to remind us that this is not simply a straight line process – we may twist away and go in a different direction at this point.

4. SO what?

Now that we have all these ideas – which ones matter? Which ones help us answer the So what? question?

Which ones are going to make a difference to the outcome?

We need to select the ideas and approaches that we think can be implemented and should be tried out.

5. GO – take action.

If we have gone through the effort of thinking through the problem in this way, we should have a good idea of how we can solve the problem and the approaches we can take.

Now it’s time for us to act – to start making and implementing plans.

Summary

This may seem an easy and obvious approach – but all too often the thinking mistakes we make are basic – and we do them because we are trying to think under pressure.

Using this framework can help slow us down and improve our chance of coming up with good solutions.

How do we change from one product to another?

ladder-vs-stack-models.png

One way to think of change is like a ladder.

We move from rung to rung, stepping off the old one and committing to a new one.

For example, we used to burn firewood for cooking, and still do in some places. Then we moved to transition fuels, such as coal or kerosene. Then we might use cleaner fuels, such as electricity or natural gas.

This kind of transition seems straightforward, one way (upwards) and natural. You move from one choice to another and eventually stop doing the things at the bottom.

Another way to think of change, however, is like a stack.

In this model, you stack different choices on top of each other, perhaps continuing to use them all at different times.

You may try out two approaches at the same time, like two boxes stacked side by side, before moving on to try something else.

Continuing with the energy example, you may have gas-fired heating, but also install a wood-burner – going back to using firewood for heating.

Neither model is quantitative – but they provide different ways of looking at a situation.

Take software, for example. Let’s say you have a system that is a significant innovation on what is already there.

If you think of change like a ladder, then you need to persuade your market that they have to switch from what they are doing to your product in order to benefit.

If you think of change like a stack, then what you need to do is persuade your market that what you have builds on what they already have to create more benefits than they enjoy right now.

There is some evidence that the stacking model is a more accurate depiction of how people actually make choices than the ladder model.

The main difference is that the ladder assumes that people need to make a choice between one thing and another. This OR That.

The stack assumes that people want to hold on to what they already have and choose things that build on existing investments. This AND That.

Focusing on what people want will probably be more effective than telling them what they need.

What makes you special?

distinctive-capability.png

In the last few months of the year teams around the country are looking at the year ahead, setting budgets and targets and trying to work out what do do and where they should focus their time and energy.

Should you focus on where you want to go – your goals and the end result?

Do you need to know where you are going so that you know when you are there?

Will having the right vision and mission statement and doing lots of motivating, team building activity help you succeed?

Is getting the right people on the bus the secret?

One way to see through the euphoric fog of motivational management is to consider what makes you special.

What is it that is distinctive about your business – the qualities and attributes that mean you will do better than others in your space?

John Kay, a leading economist, came up with the concept of distinctive capabilities in the 1990s.

He argued that distinctive capabilities are what you have, not what you would like to have, or hope you have.

You might start with a number of capabilities when analysing what is distinctive about you. Are you cheaper than the competition? Do you have smarter people? Is your reputation better?

Key said that there were only a few types of distinctive capability – and they stemmed from how innovative you were, how you structured yourself and what people thought about you.

He termed these innovation, architecture and reputation.

So, what do distinctive capabilities such as these have in common? How can you score them and see whether you should focus on them or not?

There are four questions to ask yourself. Is what you do:

  1. Hard to make and build? Does it take a long time or is it difficult to get the ability to build and maintain your capability?
  2. Hard to do? Is it possible to turn your activities into a recipe – something that can be recreated or adapted elsewhere?
  3. Hard to copy? Is what you do protected – either by laws or by its nature – a trade secret for example. Can it not be replicated easily.
  4. Hard to buy? Is it possible to buy what you do on the open market or is it something unique to you?

If what you do is impossible for others to make, do, copy or buy from anyone other than you then congratulations – you are on your way to a monopoly.

For most organisations, however, you will be somewhere on a range.

A strategy that works will focus on those capabilities that fall on the right hand side of the range when answering those four questions.

Whether you looking at yourself as an individual, a business unit or a business group, the chances are that you will get better returns by building on the distinctive capabilities you already have, rather than what you want.

Why do you do something?

utility-tree.png

People do things for reasons.

The reasons are the benefits you get – the things you have gained, are gaining or expect to gain from taking a particular action.

All these reasons and benefits, the associated hopes, dreams, goals, objective, prizes, are packaged by economists into one, rather dull word – utility.

Utility is what’s in it for you.

Understanding how utility is created is crucial when trying to make a decision, or when getting someone else to make a decision.

One way of doing this is by drawing a utility tree.

For example, around this time of year, many families are thinking about options. They want their kids to go to a good school – but what should they do?

Say they have to move – and they have two options. They can buy a place or rent a place. If they buy, they can buy a big house or a small house. If they rent, they can settle for an OK house.

Whether they buy or rent, as long as the house is in the right area, they are fine for schools – so the outcome is the same in all cases.

What makes the difference when choosing between the options for this family?

Lets say one partner wants a big house. The other, more familiar with their finances, doesn’t want the associated costs because they will stretch them too much.

A smaller house would make one partner happy, and the other could deal with it – but it’s not a preferred option by any means.

Both of them, however, really don’t want to rent again and deal with the issues of agents, commissions and having to have regular inspections.

These reasons are the utilities associated with the situation.

Now, if you keep all this in your head, it’s really hard to have a mature discussion that doesn’t end up in an argument.

Instead, drawing a utility tree helps to make the options, outcomes and utilities involved clearer.

The key thing is to consider each option you have by itself, using the same criteria to evaluate each option and making sure that you look at it from enough points of view to be happy you have thought through it properly.

For example, seeing the tree in the picture above clarifies the situation more than describing each person’s point of view in words.

The point of view someone takes, their perspective, is crucial in being able to understand what will and what won’t move them.

We can often only see things from our point of view.

Making good choices, however, whether in personal situations, when making investments or when persuading someone else to make one, often need you to see things from another person’s perspective.

What this also means, quite often, is that the best solution will need to be a compromise. For example, you might be able to persuade your partner to have a smaller house, as long as you can also have a nicer car.

Understanding utility simply means that you can better understand what people want and what they will do – and that means you are more likely to get what you want as well.

Why choice makes it harder to choose

paradox-of-choice.png

There are two kinds of people: those who choose quickly, and those who take time to choose.

In his book The Paradox of Choice, Professor Barry Schwartz argues that the amount of choice available to us now is making people unhappier and more dissatisfied.

The people who take time to consider their options fare worst here.

There are too many to look at, too many criteria to compare and it’s a struggle to find one that is perfect.

Just looking at more options makes you perceive something you already have as less valuable.

As a result, having choice just makes one afraid of making the wrong decision.

Fear of regret then drives decision making, paralysing people into doing nothing.

We’d be happier, according to Barry, if we:

  • Restricted the amount of choice we had voluntarily.
  • Aimed to be good enough rather than the best.
  • Had lower expectations.
  • Required that all decisions were final and could not be reversed.
  • Paid less attention to what other people do.

If you’re on the other side of the table and you want to improve your sales then instead of focusing on how best to meet what you think people need, make it easier for them to choose what you do.

If choice is paralyzing, simplifying and making it easier to choose will help more people make a decision.

This will help even more in four situations:

  1. When products are complex.
  2. When comparing options is difficult.
  3. When you’re not sure what you prefer.
  4. When you want to make a quick decision.

In summary, when you next need to decide between increasing choice, or making it easier to choose, try the latter.

Can you figure out what really gets results?

how-to-measure.png

How do you set things up so that you can get results?

Take an example that many people have to deal with – meeting sales targets for their business unit.

The results are expressed in monetary terms – you want to add X in sales by the end of the year, so what does that break down into by month, by week and by day – depending on how the business you are in makes its money.

If you are in a retail business, with transactions happening every day, then a daily system of monitoring profit and loss may be enough to tell you whether you are in or out of the money. Depending on how far away you are from target, then you can take action to change things.

In this case you are in a business where results can be measured in great detail, so you simply monitor the end of the process.

But what if you operate in a different kind of business – say you sell large and complex systems – power stations, for example, or provide ad-hoc consulting services. The results in such businesses expressed in financial terms may not be as predictable.

So what happens then?

The markets and analysts like companies with smooth lines trending upwards. They don’t like surprises or lumpiness in results. So, the companies give them what they want – managing their reporting so that you get the effect of a smooth line, even if the underlying business is lumpy.

This takes you from monitoring results to manipulating results.

The logical thing to do might be to consider the other end of the process.

If the results are hard to predict – you still need to do something every day to get them.

You need to pick up the phone, engage with someone, create something – the daily activity is what eventually produces those results.

Is it possible that measuring aspects of daily activity that correlate with results can help get results better than measuring the results themselves?

In other words, measured daily activity could lead to results which can then be measured in financial terms.

The point is this – in order to track how you are doing, you need to measure and monitor something every day.

There is no point in measuring something daily that does not lend itself to being broken down into a daily measure.

Instead, find something that you can measure daily that correlates with the result and measure that instead.

What is data?

types-of-data.png

The information business is a complex one.

The chances are that virtually all the business intelligence you have now is stored and processed on a computer.

And that carries responsibilities and creates obligations.

So, what is data?

The long version is here but in short:

Data is information that is processed by a machine, recorded on something (including paper), filed somewhere or can be accessed later including information held by public bodies.

Basically… everything.

Data turns personal when you can identify a person from it. Even if you need it and something else to identify someone it’s still personal. If it contains an opinion about the person, it’s also personal.

An example of this from the ICO is that water meter data, even if addressed to the occupier, is personal because it could be used to tell the habits of that person and identify the address they live in and so is personal.

Personal data turns sensitive when it has something that the person would consider private, or that could be used to discriminate against them in some way.

It’s very broad, so that even something publically visible, but covers them. Even if the person makes the information about them public, it’s still personal and sensitive.

What this means is that almost anything you do in modern business that requires using a computer and working with other people is going to involve thinking about data.

When the UK leaves the EU, the rules are likely to stay the same.

Being clear about this definition will help you get started on what you do with the data – how you keep and use it.

Note: You may be one of those people that worries about the use of ‘data is’ versus ‘data are’. ‘Data is’ sounds better…

Happiness is just around the bend

happiness-u-curve.png

It’s true – your life is getting worse.

If you’re in the period between being an adult and heading towards middle age, that is.

The U-curve of happiness is a theory that says we are happiest when young, as children.

Happiness levels decline as we grow and turn into adults, reaching a low in middle age.

But what about children, you might ask. Surely parents are happy?

It turns out that they aren’t, not really.

The sleepless nights and physical exhaustion that comes from having children, and then the sleepless nights and mental exhaustion that comes when they turn into young adults means that people score low on happiness measures around that time.

But then, as you come to terms with life, things become better.

As you get older, happiness increases once again, as you get to do what you want to do once again, and get some of your time back.

The U-curve theory has its critics – many people do not have happy childhoods, many people have a difficult and lonely old age and many people don’t live in free and prosperous countries.

It may be something that only applies to rich and generally healthy population groups.

What this tells us, however, is that our expectations of the future are made up of socially constructed ideas.

You might think that parenthood might be the happiest time of your life. But the experience itself might not be, even though you wouldn’t change a thing.

It is easy to assume that older people have little to contribute – but today people are living and working longer than ever.

We are experiencing a time when three generations can work in the same organization together – all at different stages of happiness in their lives.

Even if the theory is wrong, the thing with a U-curve is that it’s pretty helpful when trying to come to terms with a situation.

After all, however bad things are, you know they could always be worse.

And when you’re at rock bottom, you know the only way is up.

How to build trust in your organization

trust.png

Trust is a rule of thumb – a way to deal with situations where we are asked to give or do something when we don’t have enough information or control to be certain of the outcome.

There are many definitions and approaches to trust – so what are the things that create trust or destroy it – and what actually happens in our brains when we trust someone?

The neuroeconomist Paul Zak carried out a number of experiments that helped explain how brain activity is affected by trust and what organizations should do to increase trust.

He found that there was a chemical in the brain called oxytocin. The amount of oxytocin is related to trust – the more it is produced, the less fear and more trust you have towards a stranger.

Creating an environment that promotes oxytocin production can lead to higher trust in people and build trust in your organisation.

Zak found that managers could improve trust by doing eight things – all of which might seem obvious in retrospect, but which are now supported by the science. Doing these things better should improve oxytocin levels across your organization.

Start by praising people more when they have done a good job – and do it soon after they have done it. People like it when their work is noticed and appreciated.

Make sure that everyone can do what they are asked to do – that it’s not too hard or too easy. People work best when they are challenged and stretched, but not when they are stressed or bored. Performance is all about setting achievable goals that need you to push yourself.

People like to be in control. Many people would give up pay for more freedom and control over how they do things. They also work better when they feel like they have created something rather than when it is imposed on them.

You also work more on things you care about. Clearly what you are interested in needs to be aligned with what the company needs to get done – but the more you can get people contributing in areas that they are interested in and care about, the better your chances of getting good work out of them.

It’s important to keep people informed. Secrets, closed groups and rumours can all act as a drag on performance. Open and frequent communication, regular discussions, updates and feedback can all help keep people feel like they know what is going on and can get on with their job.

Working in silos or mostly alone isn’t very helpful. It’s important to create opportunities for people to connect and work with others, through working groups or project teams, for example. There is a link between the social ties at work and job performance.

There is a difference between a job and a career. People do jobs, but they invest in a career. The latter takes time and effort and is a journey of personal and professional growth. Managers who can see that and help their people to grow will increase trust.

Finally, people like to help others. Asking for help lets people cooperate and work together – and once again has an impact on trust.

Lenin once said Trust is good, but control is better, and that didn’t end out that well.

Keld Johnson has a better approach, saying Control is good, but trust is cheaper.

%d bloggers like this: