
Monday, 9.31pm
Sheffield, U.K
An August update… sounds like there was a July, June and May update, doesn’t it?
No, but here’s what’s happened so far… in case you weren’t around and don’t remember the back story.
Last year everyone got very excited about cryptocurrencies.
Bitcoin went up from around $1,000 to over $16,000 by December 2017.
I started looking at it a little more seriously then, pulled along by the euphoric tide that swept the market along.
It’s hard to understand something like that by just looking at it. To really get to grips with you need to engage with the market – make some real decisions with real money.
It’s easy to be an armchair commentator. It’s simple to predict how markets will move and how much money you would have made if you got in at the right time.
But, if you haven’t put your money in and watched it fluctuate, then you haven’t experienced the heart palpitations and emotional reactions that come along with such decisions.
Because, make no mistake, investment decisions are emotional decisions. When it’s your own money on the line, your lizard brain takes over and you either flee in fear or stand and fight with violence.
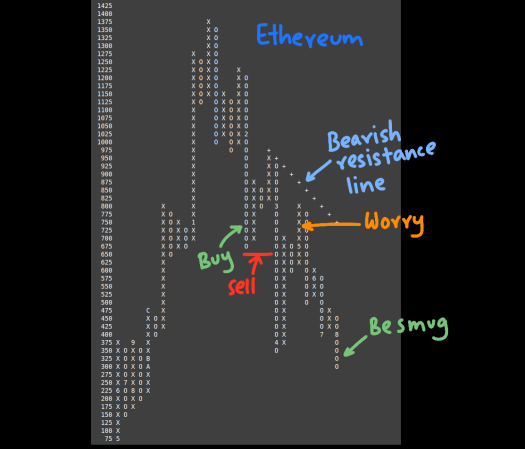
Back to the story so far… in February 2018 I decide to take a position – buy some Ethereum. That’s the Buy point on the chart.
The chart… well, the chart is called a Point and Figure chart, and it isn’t one that you’ll see often, if at all.
I had a book by Thomas J. Dorsey called “Point & Figure Charting” that explained how to do this. As the book says, this is “the oldest and most completely tested method for technical analysis of stock prices”.
In a world of get-rich-quick merchants, I knew this book was the right one for me when I read the line Tom, ain’t but one way to make money in the stock market. Slowly.
So, before I put a penny in, I built a trading system to manage my risk based on the Point and Figure method. That’s step one. Have a system
The beauty of this method was that I went into my trade knowing when I was going to get out.
As I wrote in my post back in early 2018, I bought in February at around $725, and set a stop-loss at $650.
I sat back as the price went to 875 and 950, cautiously optimistic that I had called the bottom of the market.
Then, in March 2018, the price started crashing off again.
When it went through my stop, I sold. That’s step 2. Follow your system.
And now, it’s several months later, and I’m cautiously optimistic that I got out at the right time.
Yes, the price went down and down and down, then up. In late April and May, I might have been worried that I had panicked early.
But… the chart helps again. There is a line called the bearish resistance line, strong as a stone wall, that the price didn’t breach.
The market was still bearish – and the selling pressure came back and the price has fallen further.
So, one might be excused some smugness at this point. I have no money in the market. But that’s because I made the decision to do that. Not because it’s something that I felt I would have done had I had some money.
The whole crypto space is still a fascinating and evolving space.
But, you would do well to approach it with your rational brain turned on and a system in place to help you make better decisions.
Here be dragons.
Cheers,
Karthik Suresh

One Reply to “”