
Monday, 7.03pm
Sheffield, U.K.
If I’m interviewing someone I need to know everything about them – I do these massive spider diagrams. Everything under different categories, and certain questions in other categories. – Cat Deeley
I’ve been thinking about how we use visual techniques to make sense of information. This is a rather wide topic and spans early work done sixty or so thousand years ago by an unknown Neanderthal on a wall to modern digital concepts. Why are diagrams so powerful and how have they changed over time?
Let’s use a visual technique to explore this question in a satisfyingly recursive way. Graph Theory is a mathematical technique that resulted from the study of a puzzle. The prolific mathematician Leonhard Euler was working on a puzzle that involved the now Russian village of Königsberg – a place with seven bridges connecting two islands to the mainland. People wondered whether it was possible to find a walking route that would cross each bridge exactly once. Euler proved that such a route existed and invented graph theory along the way.
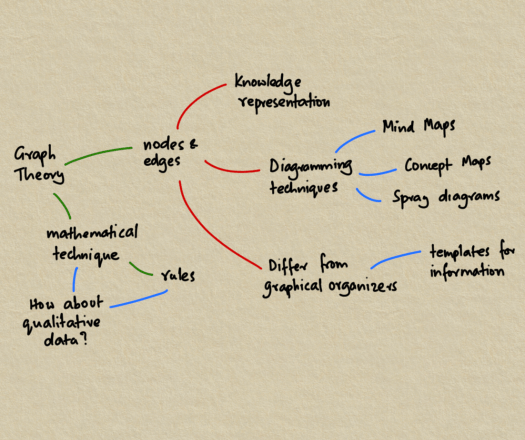
Graphs are hugely useful – circuit diagrams and chemical compound models are essentially graphs. But nodes and edges can do more than represent mathematical elements. They can also be used as a form of knowledge representation as you can see in the picture above.
For example, diagramming techniques including Tony Buzan’s Mind Maps, Novak and Gowin’s Concept Maps and the Open University’s Spray Diagrams can all be used to represent data and the connections between data. These are not templates that are filled with information like graphical organizers but rather containers for information and relationships that help us navigate from idea to idea.
And that’s interesting because so much of what makes the modern world work is the ability to share and connect ideas. It’s the basis of the world-wide web and websites like Wikipedia. If we want to make sense of the world it might be a good idea to see if these kinds of tools can help.
Over the next few posts I might follow the trail of some of these ideas and see what’s out there about how scientists and writers have used drawing in their work.
Cheers,
Karthik Suresh

One Reply to “”