
Thursday 9.21pm
Sheffield, U.K.
Social networks do best when they tap into one of the seven deadly sins. Facebook is ego. Zynga is sloth. LinkedIn is greed. – Reid Hoffman
In a previous post I looked at which marketing model might be most useful when planning a campaign.
The basic idea is to do more than the competition.
That sounds simple, but how do you actually go about doing that?
It comes down to analysis – analysing what they’re doing and figuring out where you can get an edge.
So let’s say you start with what comes up on Google – that’s one source of data for your search term.
But then you have LinkedIn and Twitter and all the social networks.
You’ve got offline events – training sessions and affiliate programs.
How can you pull all this together in some kind of coherent way.
It turns out that this is an established branch of sociology called Social Network Analysis.
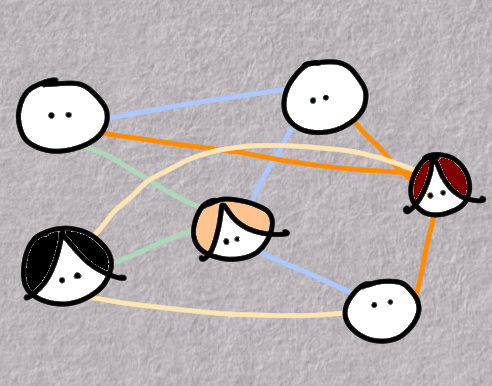
And it comes down to nodes and links.
Nodes are individuals or organisations and they are connected by links.
These links can be relationships, common interests, shared values or content that they are exposed to on different platforms.
As you can imagine, the number of different types of links can increase quite quickly.
You can’t analyse these in your head or on a spreadsheet – usually you need software to help with doing that.
Software like Social Network Visualizer.
Now, when you read the documentation for these tools it gets complex pretty quickly.
There’s lots of talk about adjacency matrices, cohesion measures, centrality and prestige and community detection.
Which basically means the number of things you’re keeping track of, whether if I link to you, you link back to me and who the super important people are in a group – and if there are cliques and subgroups.
Okay – can we apply any of this to our market research efforts?
Well… before that let’s look at something which, depending on your point of view, might make you a little nervous.
The UK police have a guide on how to use social network analysis to combat gang crime.
Clearly the police have a reason to gather intelligence on the bad guys – and they collect information on them and their links with others.
There’s a useful table that shows you how many criminal links there can be between individuals and how to code these links.
All that data can be quite hard to understand if set out in a table but when you visualise it you can imagine how the people at the centre – the ones with influence and reach show up as larger nodes.
So, in theory, you could use a similar approach to understand how your market operates.
Clearly you’ve got to be sensible about doing this.
Recently many data mining organisations have changed their tune when it comes to the ethical use of data.
They say that each piece of data is not like gold or oil – a commodity you can exploit.
Instead, it’s a piece of someone’s life – and you need to respect that and treat it with care.
So creating your own intelligence file on people in organisations is probably not the most ethical way to do things.
But that doesn’t stop you from perfectly legitimate things like mapping organisations and their links to each other.
If you have a competitor that is so entrenched with the public sector bodies, key decision making centres and other institutions isn’t it better to know that rather than trying to fight them on an uneven playing field?
Or if you’re an activist organisation you can map those organisations that are going to be receptive to your message and work with you.
The thing with tools like these is that there’s little or no information on how to use them effectively to solve real business problems.
Which is why the police example is actually quite a useful one of how such technology can be applied to a situation.
It’s a tool that appears to be underutilised and maybe it can help you with market research.
It’s probably sensible to suggest that you use it with care.
Cheers,
Karthik Suresh
