How to choose your next job

decision-table-job-parameters.png

How do you make a decision about what to do next?

Which job should you choose, which option should you explore, which project should you spend time on?

These are problems we face every day, often under time pressure and with limited information.

Take, for example, one of the most important decisions you make – what job to do.

This is a decision that has a major impact on your life and carries a lot of emotional weight. You will be influenced by experiences in previous jobs and what your goals and expectations are of the future.

It is a high stakes, high emotion decision.

In a crucial decision such as this, you should be taking into account several parameters and thinking clearly and carefully about your options and what you should do.

Instead, the human brain often gets overwhelmed and focuses on one or two factors and excludes other, equally important ones.

It defaults to emotional decision making, with people making choices about how they feel about the factors that seem most important at the time.

One study, for example, found that more than half of the people surveyed left their job because of their relationship with their manager.

That single factor might have been enough to discount all the other positive factors that might have made it a better choice to continue with that job.

So how do we make better decisions when it comes to a crucial problem like choosing your next job?

One tool that can help is called a decision table.

First, identify the paramters that are important about the problem.

What are the things that you should consider when assessing the choices you have open to you?

When you are doing this, it is important to consider more than just the ones that come readily to mind. What do other people think, what does the research indicate?

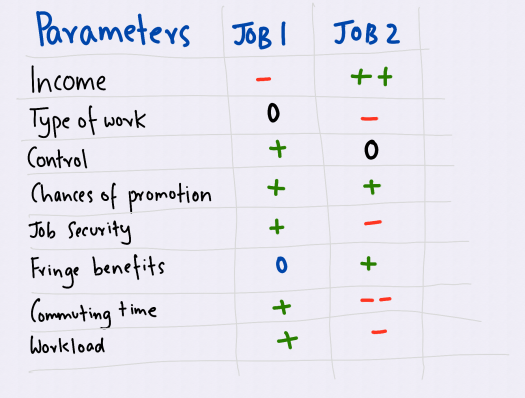
The list of parameters in the image above are from research that was carried out that identified the eight factors that were most important to the study participants when it came to job satisfaction.

Second, assess each job option you have against the parameters.

The question to ask yourself is, “Will this job mean I am better off or worse off on this parameter”.

A simple coding system to use is to use 0 when there is no change, + when you are better off and when you are worse off.

In addition, you could use ++ and to indicate when an option makes you much better off or much worse off.

Just doing this exercise means that you will consider each factor in turn and assess how your life will improve or worsen under each option.

At the end of the process, you will have a table that shows you how each job compares on the parameters or measures that are important.

Now that you have considered all the parameters, you can figure out which ones are more important to you.

Are you, for example, prepared to take on a long commute for the prospect of much more pay?

Or would you rather have less pay and a better commute?

Are you ambitious – is getting a promotion really important? Or are you at a stage when you want a job that will pay for food while you get on with something that is important to you, like a creative pursuit?

A completed decision table will help you have that discussion with yourself or with someone else and help you consider all the factors that are important. It will lead to a more balanced decision.

It also greatly increases the chances that the decision you eventually make will actually result in better job satisfaction.

The same process can be applied to other areas. Perhaps not things like whether you should have coffee or tea, but definitely the important decisions, like where to invest, what to do, who to enter into business with.

When you have a problem that is important and where there is a high emotional component, that is the time to get out a pencil and start working on a decision table.

Why good people do bad things

you-and-your-environment-circles.png

We all know about the horrors that took place during the Second World War, in Cambodia, in Rwanda.

The history of humanity, in virtually every culture, is littered with stories where one group of people abused their power over another.

What do we infer from these stories?

One inference is that is was all down to a small group of individuals who were fundamentally evil and were able to dictate what was done from their position of power.

From Vlad the Impaler to Pol Pot, from the Nazis to Saddam’s Iraq, we can point the finger and find one person to blame, or a group of people that should be tried and punished.

Would you act differently if you were in their position?

The evidence suggests that you would not.

In a famous experiment conducted in 1971 at Stanford, researchers found that it took only six days to turn nice, normal college boys into sadistic monsters.

They did this by creating a prison, making some of the boys guards and others prisoners and setting up a simulation where the guards had absolute power over the prisoners.

They set up conditions that:

  • Dehumanized the prisoners
  • Deprived them of sensory stimulation – no clocks, no views of the outside world
  • Took away their identify – they were referred to as a number
  • The guards could punish infractions of the roles or improper attitudes

The end result was that the situation these people were put into brought out and magnified some of the worst aspects of their humanity and the experiment had to be abandoned after only six days.

Why is this relevant to us now?

Surely all this is just something that happened a long time ago somewhere else to people not at all like us?

The problem is that we tend to think that bad things happen because the people involved are bad rather than because the situation they are in allows them to do bad things.

This is called the fundamental attribution error and has been described as the “conceptual bedrock” of social psychology.

In every day life, we explain away our lapses by finding reasons in our environment for how we behaved as we did.

With other people, however, we tend to conclude that others are lazy, incompetent or thoughtless, explaning their behaviour as due to their internal characteristics.

Understanding that the environment has a huge impact on how people behave is crucial in some situations.

For example, I recently heard a someone talk about visiting a care home where the staff referred to the residents by their door numbers.

“Room 32 needs a change, Room 42 is hungry”.

This is the first step to removing that person’s identity – reducing them to a number rather than a person.

Such practices should have no place in an organisation – especially one where people have power over others.

Finally, on an individual basis, we place great emphasis on personal fulfillment.

For example, do work that makes you happy.

It turns out that what makes you happy is less to do with the work you do, and more to do with the conditions of your work – do you have autonomy, feedback and control over what you do?

People in charge of designing organisations need to realize just how important the environment is in influencing how the people in that organisation behave.

If you want your people to perform, first create the right environment for them to be good.

How creating a red team helps you make better plans

Create-a-red-team.jpeg

General Stanley McChrystal, a retired 4-star US General who commanded US and coalition forces in Afghanistan, creates a “red team” when planning an operation.

The idea is that when any group of people start to work on a plan, they think about certain ideas and strategies that they think will work.

As they do this, they start to focus on information that confirms what they believe and begin to discount what does not. It just seems to be the way the brain works – a confirmation bias.

In a military situation, this can result in the wrong decision – which can be fatal.

The job of the red team, which is made up of different people from those that did the planning, is to figure out how they would disrupt the plan.

Their job is to think creatively about the ways in which the plan could go wrong and what they would do to frustrate it.

This is also called ‘devil’s advocacy’, where one expert presents a plan and a second critiques it.

Importantly, the job of the job of the devil’s advocate is only to present flaws with the original plan, not to provide an alternative solution.

If they start to think about solving the problems they find, they start to introduce new biases.

In research by Richard Cozier and others from the 1970s onwards, they found that the use of a devil’s advocate significantly improved the prediction accuracy of strategic decisions.

Using a red team helps create a plan that is solid, rather than because the people who executed the plan were lucky.

We can still see how not doing this creates disastrous results now.

Theresa May’s result in the UK general election, where she managed to lose the conservative majority, is being blamed on how her chiefs of staff created an atmosphere where dissent was not tolerated.

This led to focusing on policies that lost them support and led to electing a UK parliment with a weakened government entering crucial negotiations with the European Union.

Some people may think that is actually a better result. A stronger government with an absolute mandate may have had the power to do what it wanted – resulting in a worse outcome.

The current parliment, with a stronger opposition critiquing the government’s plans, may result in a better outcome for the country in the coming years.

Why do fuel prices go up fast and down slow?

Gas-stations-opposite-each-other.jpg

Households in the UK spend between 12 and 27% of their disposable income on transport, of which a third can go on the cost of fuel.

People spent, on average, £72.70 on transport in 2016 and the cost of petrol and diesel was the biggest contributing factor.

Oil prices went up and down in 2016. At the start of the year, they were low and went lower on abundant supplies, with the spot price of crude oil heading towards $25 a barrel.

In the second and third quarter of 2016, producers responded with spending and production cuts, which helped prices head back towards $50 a barrel.

By the end of the year, OPEC’s decision to curb production and stick to quotas and an agreement from other countries to reduce output sent prices towards $55 a barrel.

So, in a market where global prices can double or halve in a year, why do these increases or decreases not show up in prices at the pump?

A litre of unleaded petrol in the UK went from around 102 pence per litre to 115 pence per litre by the end of the year.

We’ve all seen that when global oil prices fall, the reductions don’t seem to show at the pump. But when they rise, the price at the pump seems to go up straight away.

Why is this?

It’s not just imagination. It turns out there is a phenomenon, described in the industry as “Rockets and Feathers” that takes place.

In a commodity market, where prices are posted daily for all to see, as in the domestic fuel market, retailers know what each other is charging.

If oil prices go up, one retailer can raise prices in the knowledge that others in the area will see the increase, and feel like they can increase their price as well to benefit from the increased margin.

As everyone can see the posted price, this can even act as a signal to other producers – although there is no actual collusion taking place.

On the other hand, when global prices fall, each retailer can wait for someone else to take the first step.

Again, because they can see all the prices, there is no need to drop their price until someone else does first.

So there are different incentives when prices go up compared to when they go down.

This is why price go up fast, as one retailer raises its prices, the others notice and they raise theirs as well. On the way down, everyone waits for someone else to make the first price reduction.

And so, prices rocket up and drift slowly down.

Where does the world’s LNG come from?

world-LNG-supplies-2016.png

Three quarters of the world’s natural gas is used in industrial applications and for power generation.

It burns more cleanly than oil or coal, which means that emissions from natural gas are lower.

As a result, governments around the world have policies that make using natural gas more attractive than the alternatives.

The IEA estimates that global gas consumption will grow from around 120 trillion cubic feet (TCF) in 2012 to 203 TCF by 2040.

So where does this gas come from?

The graphic above shows the top exporters of LNG by market share in 2016 according to the IGU World LNG Report 2017.

Australia now has the largest market share of LNG, going from 12% in 2015 to 44.3% in 2016, a huge increase.

Qatar remains an important source of gas, although the problems it is currently experiencing with its neighbours may have an impact on gas production this year.

Russia, despite its enormous gas reserves, is a relatively small player in the LNG export market.

The one to watch is the United States.

In 2016, the U.S. had a market share of 1.1%, making it the 16th on the list.

Over the next few years, however, it is expected to ramp up exports significantly.

In the next decade, Australia and the United States are expected to be the dominant exporters of LNG to the global market.

Who will win when it comes to developing clean energy technology?

VC-Investment-Factors.png

A series of high profile failures and strategic changes by cleantech companies raise questions about the whole sector.

Acquion energy, a maker of battery systems filed for bankruptcy in March 2017 after raising nearly $200 million from investors including Bill Gates.

Lightsail Energy, a startup co-founded by a charismatic prodigy, Danielle Fong, raised funds to develop compressed air storage energy systems, but is now changing tack to sell its containers to gas markets.

Solyandra a manufacturer of thin film solar cells, filed for bankruptcy in 2011, leaving the US Federal government liable for half a billion in a taxpayer funded loan.

An MIT study in 2016 found that more than half of the $25 billion invested in clean energy startups from 2006 to 2011 was lost, effectively result in a drying up of capital and investment to the sector.

What is going on here?

Many companies have still not figured out the economics of energy. The ones that will survive from now on will have to get their heads around some key factors.

1. Money

Cleantech companies often create new technologies, materials or processes.

These require investment in research and testing facilities, demonstration units and development installations or a track record in order to be accepted by consumers.

This means that they need a lot of money to invest in their infrastructure.

Many companies ran out of money before they created a sustainable income stream.

2. Time

Bringing a new cleantech product to market can takes months and years rather than days and weeks.

End user products such as battery packs have to go through rigorous testing, product certification and safety checks before they can be sold to the public.

The returns on individual technology projects for a customer are also likely to have paybacks that are longer than the typical corporate will accept: 5-6 years rather than 2 years.

As a result, the rates of return to investors in cleantech have been less than in other sectors traditionally backed by private / venture capital.

3: Competition

Electricity is a commodity. Makers of cleantech selling a system that creates electricity cannot control the price of the power from their systems.

They are, instead, forced to compete with existing alternatives in a commodity market.

Even in a cleantech market such as that for solar panels, new technologies struggle to compete against silicon panels.

This is not because the new technologies are not better. It’s just that the massive investment in silicon fabrication facilities worldwide has made the cost of silicon panels fall much faster than alternatives.

4: Policy

A huge amount of momentum in cleantech is driven by government policy.

Over several years, clean energy in Europe and the UK has been driven by subsidies.

In the US, tax treatment for energy from wind has resulted in large-scale developments by the likes of MidAmerican energy.

As we go forward, however, the new Trump administration wants a renaissance in oil and coal and will change policy to support those industries.

5: Buyers

Buyers and investors in cleantech companies are more likely to be existing utilities now rather than VC investors.

This is because the incumbents can add new technologies to their portfolio of existing assets rather than having to depend entirely on the new technology for income.

The energy sector has been around for a long time and change is slow. You need deep pockets to hang around

Summary

In summary, cleantech companies that have a core proposition built around a technology or process may struggle to create a sustainable income stream.

Larger systems are more economic. Scale succeeds.

TEsla has succeeded by going big fast, and its latest thing is to build the world’s biggest battery facility.

The sector will continue to need a supportive policy environment to move ahead, and we will need to wait and see what happens.

This is especially important in the US, given its size and innovative capacity.

Ultimately, the energy sector will be driven by large scale projects and policy – much like it has always been.

The maths of success

TheMathsOfSuccess.png

How can you become more successful?

One answer was inside a TED talk by Damian Kulash, the lead singer and director of OK Go, an American rock band known for its elaborate and quirky videos.

Damian explained that in one of their videos, a giant Rube Goldberg machine, there were 130 sequences that had to take place one after the other where each sequence triggered the next.

In each sequence, something fairly simple takes place. For example, a ball rolls down an incline, a counterweight lowers an object or an object something swivels on its axis and hits something else.

If each sequence works 9 out of 10 times then its probability of working correctly is 90% or 0.9.

How likely is it the band will be successful at filming the entire set of sequences in one take?

The maths of probability is used to work this out. In the equation P^n, P stands for probability and n is the number of events.

Plugging this into the equation, the probability of each sequence working is P = 0.9 and the number of sequences is n = 130.

0.9 raised to the power of 130 is 0.000001125.

That means there is literally one chance in a million that the series of sequences will work.

In life and work, we often have to do things that follow a process, where one thing needs to be done after another.

If we aim to be quite good at each thing – and get it right 9 out of 10 times, then the more things we have to do, the less often we will be successful.

For example, if an operation in a business takes 10 steps and you are 90% sucessful at each step, the probability of success is 0.9^10= 35%.

That means two-thirds of your customers are likely to be unhappy with what they get from you.

You can improve your chances of success by doing two things.

First, increase P. Get better at doing each thing.

If you get things right 99% of the time, 0.99^10 = 0.9, which means your customers are happy 90% of the time.

Only 1 out of 10 walks away unhappy. Still not great.

Second, reduce n, the number of things you have to do.

If n was 4 rather than 10, then you would get 0.99^10 = 96%.

Now 96% of your customers are happy.

In summary, the maths of success says work on optimising the formula P^n so that the answer tends to 1.

In other words: Do less, and do it better.

Why forecasting is for cows

HockeySticksHairyBacks.png

McKinsey talked what they called one of the ugliest and most common charts in strategy at the start of the year – the hairy back.

At the start of any process – a startup pitch, a sales plan, a production forecast, you need to show a chart where, from a standing start, forecasts go confidently upwards – the “Hockey stick” graph.

In reality, the forecasts are not achieved. Year after year, as actual performance stays flat or even drops, the forecasts create a series of lines that go up – and the hockey stick turns into a “hairy back” – like the ones cows have…

Why does this happen? Why do smart people get it wrong year after year?

There are a number of reasons, and they all come down to the psychology of business.

Targets are set that are not connected to the underlying business

A target is easy to set. 50% growth. 20% increase in production. 80% reduction in staff turnover.

If someone important in a business sets a target, then everyone else starts to work to try and meet that target.

Proposals are worked on to make sure the numbers reach the target rate, especially if everyone is competing for resources and the only way to get your budget for the year is to make sure you reach the target.

This is called “gaming” and a big part of good strategic planning is minimising the opportunities for gaming behaviour in pursuit of a target.

As Warren Buffet writes, if your business is based on “making the numbers”, you can well end up with a situation where you “make up” the numbers.

Targets should be based on a realistic assessment of the capacity of the business and the resources it has in place and how they create value.

Human biases get in the way

Once someone decides that a particular approach is a good idea, confirmation bias kicks in.

That person now looks for information and data that confirms their point of view, and discounts or ignores information that disagrees with it.

People believe that all you need is a goal and optimism and you will do anything with whatever you have.

In reality, what you achieve is often determined by mundane things like whether you have the resources and time to do fairly basic tasks well day after day.

If it eventually turns out that the idea doesn’t work, attribution bias helps the person explain it away by blaming whatever seems convenient.

Ultimately, although forecast setting seems very scientific, there is an emotional dimension to almost everything we do, and that causes us to use shortcuts, see patterns where none exist, tend to believe what we would like to be true, explain everything and feel like we operate more logically than we really do.

How to create better forecasts

There are two ways to improve forecasting.

First, put better decision making processes in place. Use techniques to generate ideas, encourage dissenting views and create real discussion, debate and challenge about options and what they mean for you.

Second, listen to the voice of the business. Targets need to be connected to the business, and there will be lots of data that shows you what is happening.

The trick is to convert this data into insight, separate out what is signal from the noise and connect decisions to data.

A roundup of BREXIT risks: What does it mean for you?

BrexitIsComing.png

Theresa May invoked Article 50 of the Lisbon Treaty on 29th March, giving the UK two years to leave the EU – on Friday 29th March 2019.

The government’s focus over the period is on laws, transferring EU law into UK law and deciding what to keep and what to scrap.

What are the really big issues from the UK’s point of view?

There are 3 things that come out of the withdrawal letter sent to the EU.

  1. If the UK leaves the EU without an agreement, trade will continue on default World Trade Organisation (WTO) terms but it would be good to have a free trade agreement.
  2. We have to work out what happens to citizens currently living and working in different countries.
  3. It would help to have an implementation period to avoid a cliff edge.

The negotiations between the UK and the EU need to unpick over 40 years of processes and go through thousands of points, but these are probably the most crucial overall.

What about individuals – what could happen to us?

Things will cost more

The fall in the value of the pound has made imported goods more expensive. People expect the currency to stay low for the long term now, so prices could increase rather than decrease.

Travelling could involve more checks

At the moment, there is visa free travel across the EU. In some countries, UK citizens can stay for up to 90 days without needing a visa, and that sort of arrangement would help with tourism.

If you are planning to stay for longer, that may require visas in the future.

Common services could change

There will be an impact on areas like health cards, insurance, car number plates and so on where the outcome of the negotiations will determine where you buy them and what it means for you.

What will happen to businesses?

The risks for businesses fall into three broad categories:

  1. Labour
  2. Trade
  3. Finance

A number of industries depend on international labour

Sectors such as Accomodation and Food Services, Manufacturing and Transport have between 20 and 30% of their workforce made up of non-UK nationals.

These businesses will have to prepare for the cost of replacing or recruiting workers.

A trade deal is crucial for exporters and importers

Many products involve supply chains that criss cross the EU.

The Airbus supply chain, for example, has parts built in several different countries. Could the parts built in the UK have to pay additional tariffs? Or, could those manufacturing tasks be moved to Europe.

Four-fifths of cars made in the UK are exported and more than half of these go to the EU.

The financial sector is exposed to similar risks. Activities carried out in London may move to Hamburg or Paris.

The costs of doing business don’t look like they will go down

If the exchange rate remains low, companies that import will have problems while those that export could see increases in sales.

Wages, however, will probably rise if there are fewer workers available and the value of the remaining pool goes up.

Agriculture, in particular, could suffer both from a shortage of workers and from the loss of EU subsidies.

Summary – a model for assessing risks

As a starting point, it makes sense to fall back on Michael Porter’s value chain.

What are the things you do to deliver a product or service to your market?

How will you BREXIT affect you in each of these areas:

  1. Your infrastructure – office locations, equipment, materials.
  2. Your workforce.
  3. The technology you use.
  4. Procurement – how you buy everything you need.
  5. Inbound logistics.
  6. Operations.
  7. Outbound logistics.
  8. Marketing and sales.
  9. Service.

Will BREXIT increase costs or decrease costs for you in these areas?

Will it create opportunities or result in lost business?

With less than two years to go, it is time to get busy planning for the future.

Note

Drawing – inspired by the work of Chaz Hutton

The significance of 46

Random46.png

What we believe is significant is heavily conditioned by the media and what it chooses to focus on.

The BBC website, for example, now changes little from day to day. A few new stories come on that are shocking or terrifying, while other stories that are popular because they were shocking or terrifying show up day after day.

It gets harder to think independently when everyone is shown (roughly) the same collection of material from news sources as everyone else.

Search tools cause you to focus on what you know – because it is a little difficult to search for what you don’t know, or what you aren’t aware of yet.

One approach to deal with this is Edward De Bono’s random-word technique, described in Think! Before it’s too late.

Find a random word, for example by opening a book at random and pointing at a page with your eyes shut, and then see where that word takes you.

This may seem a little absurd at first. Its main benefit, however, is that it opens up a new line of thinking, something you may not have considered before.

The book closest to me is “The Weekenders: Adventures in Calcutta”. The word that came up, or number rather, is 46. Where will that take us?

Some interesting places it turns out.

Code 46 is a movie that came out in 2003, a futuristic romance story where the characters are genetically incompatible.

The 46 degree halo is a rare ice crystal halo that forms when sunlight enters ice crystals.

Expedition 46 to the International Space Station ran from December 11, 2015 and ended March 1, 2016 and is significant because Tim Peake was on board, the first British European Space Agency (ESA) astronaut to fly in space. The mission patch shows the Union flag prominently because of this.

The Mark 46 (Mark XLVI) is the forty-sixth Iron Man Armour and appears in Captain America: Civil War.

Directive 95/46/EC of the European Parliament talks about personal data and the movement of such data.

The Model 46AS food waste disposer is an entry level disposer for smaller households.

The only slightly sinister sounding Division 46 of the American Psychological Association looks at how to use psychology in media communications and technology. That’s not scary at all…

The KC-46A Pegasus is a widebody air to air refuelling tanker.

In 2015, Americans checked their phones 46 times a day.

And finally, and rather delightfully, Organism 46-B is a 14-legged giant killer squid discovered in the Arctic that is now being weaponised by the Russian military.