Why we all need to experience the overview effect

the-overview-effect.png

What happens to us if we see our planet from space?

The overview effect is a mind shift experienced by some astronauts when seeing the Earth firsthand from space.

They immediately get that we all live on the same small, fragile planet protected from the void by nothing more than thin air.

And the things we do to mess things up here – from conflict to resource exploitation – are simply stupid and what is needed is the united will to do something about it.

But – less than 600 people have travelled space and that probably isn’t enough to create a movement.

As a starting point, perhaps we can look at some pictures.

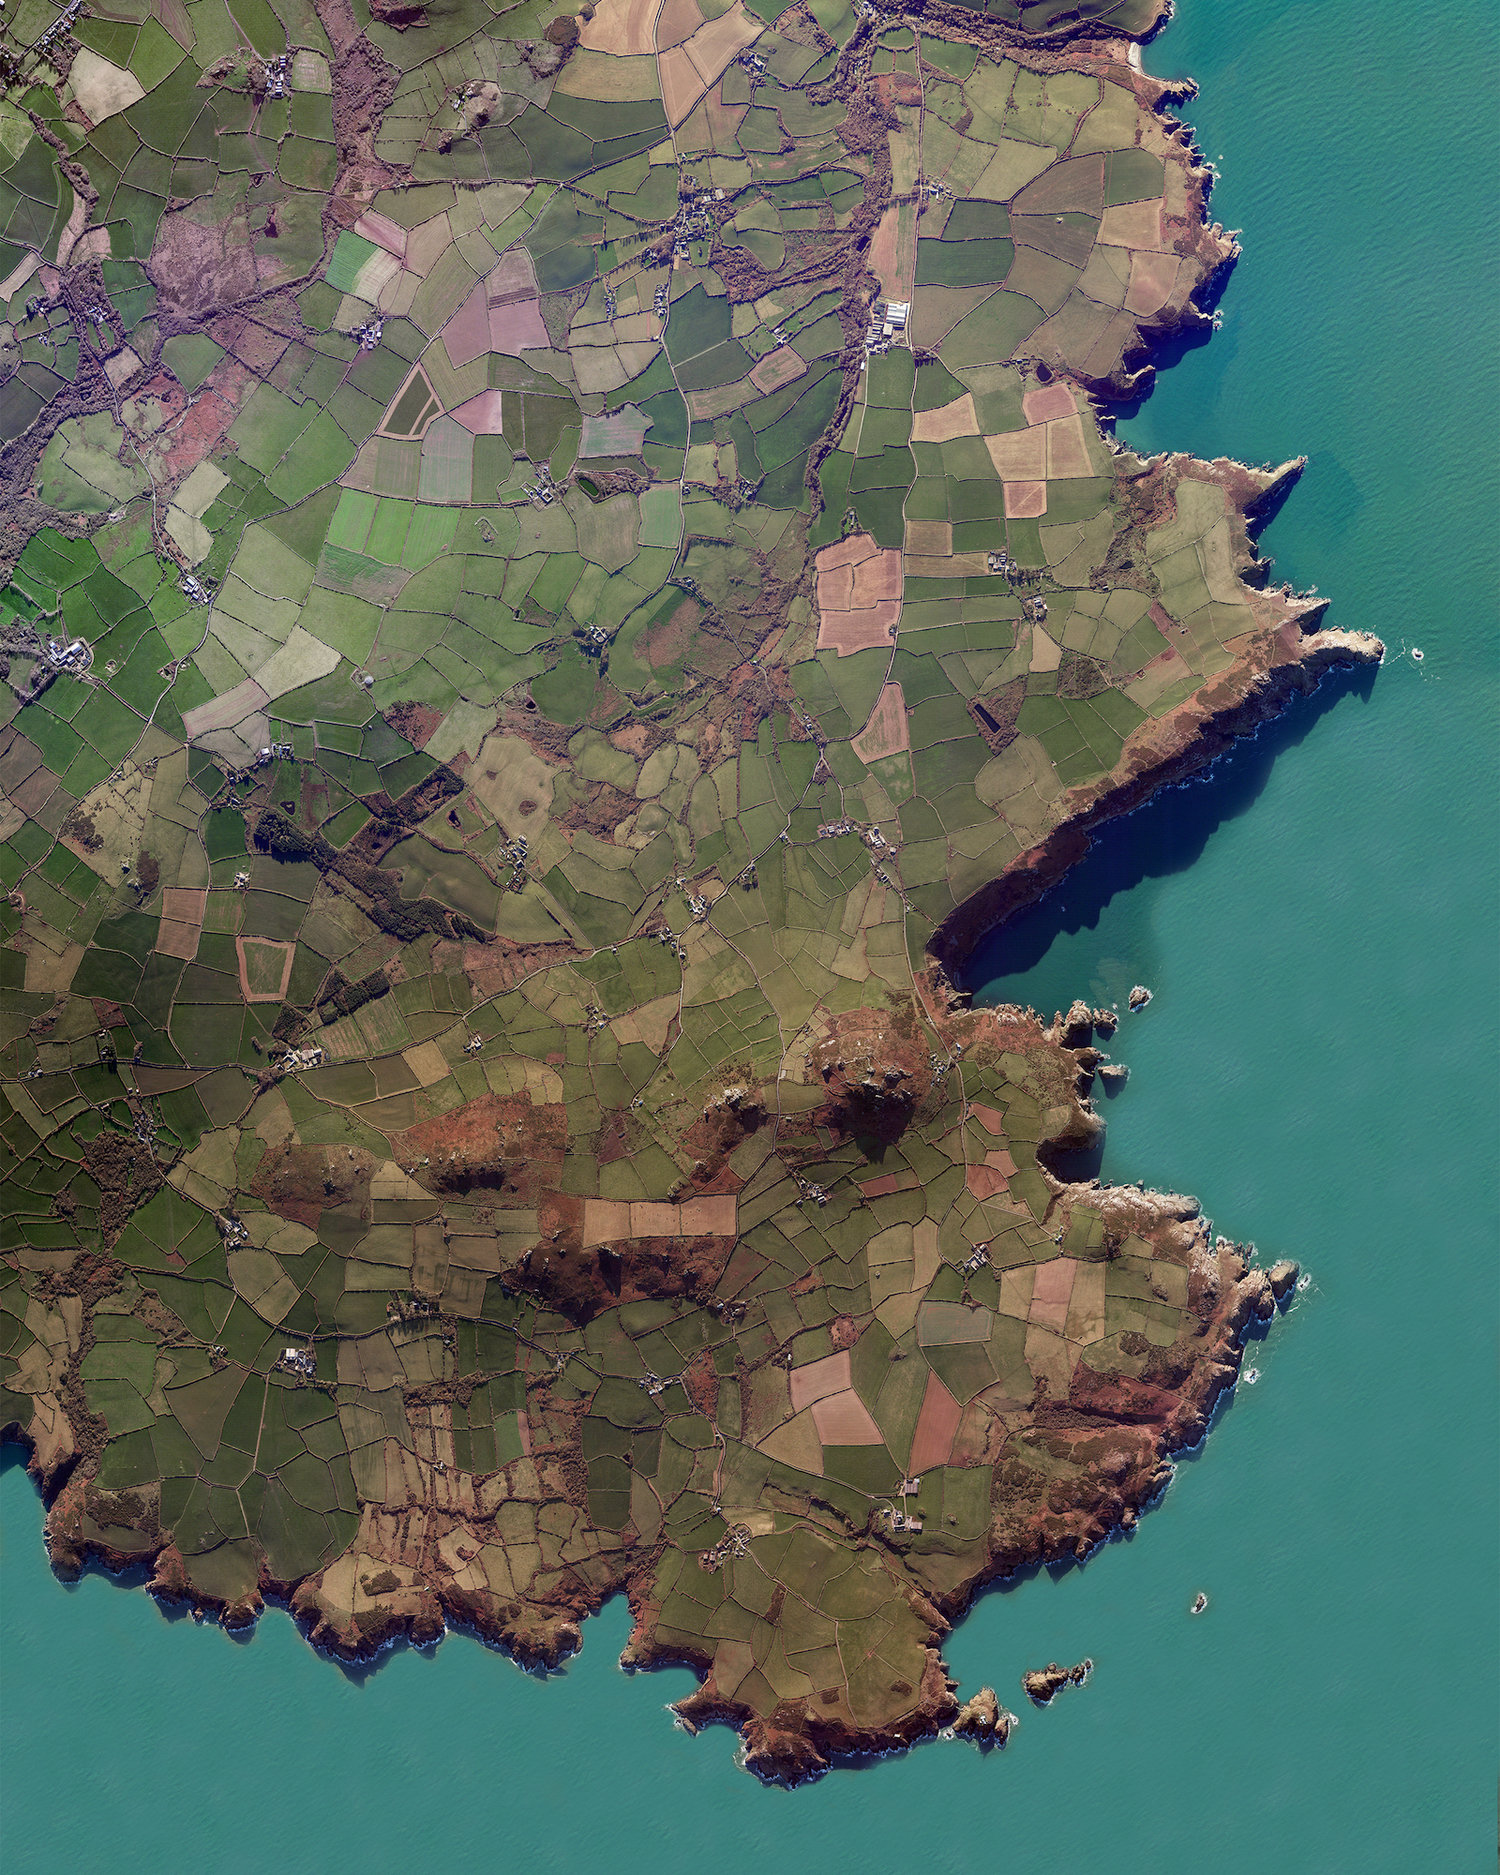
Benjamin Grant started a project called Daily Overview that curates stunning images of the Earth from space and our impact on it.

These images capture how we have completely taken over the planet and the scale of activity and building we carry out – from deforestation in Bolivia to iron ore mining in Australia.

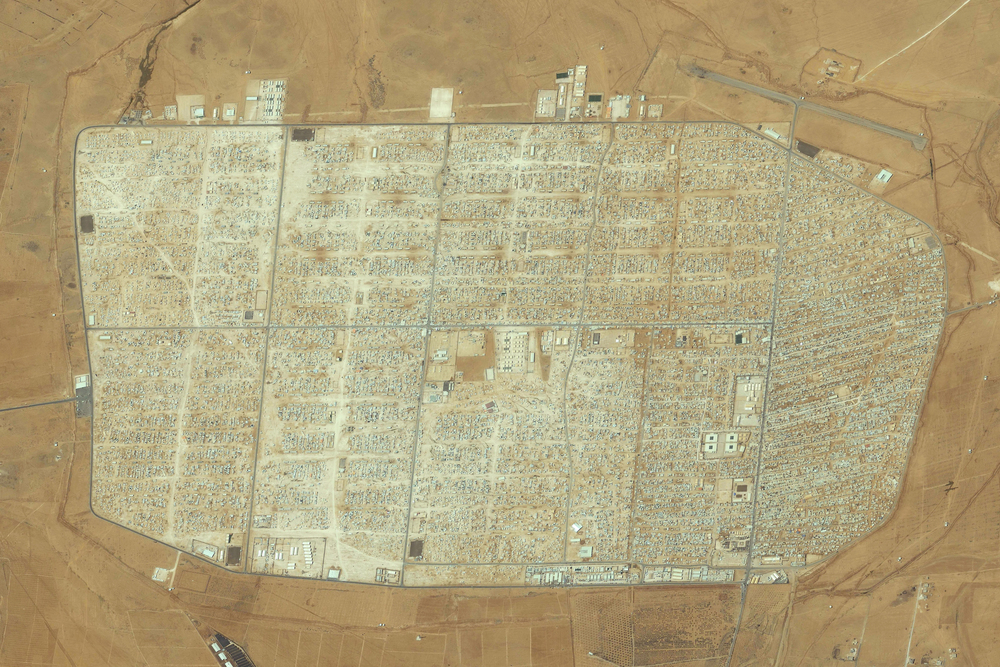
A related set of images called juxtapose shows images of before and after – how Dutch tulip fields bloom or how a patch of desert turns into a refugee city.

Contrast “England’s green and pleasant land” with the Zaatari Refugee Camp in Jordan that holds refugees fleeing from conflict in Syria.

Grant was inspired by a film from the planetary collective, available on vimeo and now viewed nearly 8 million times that explores the overview effect.

We often think that solutions to problems like climate change have to be technological – we focus on things like reducing carbon through more efficient technology or processes.

To really get people engaged we should help expand their perspective and see things from a different point of view.

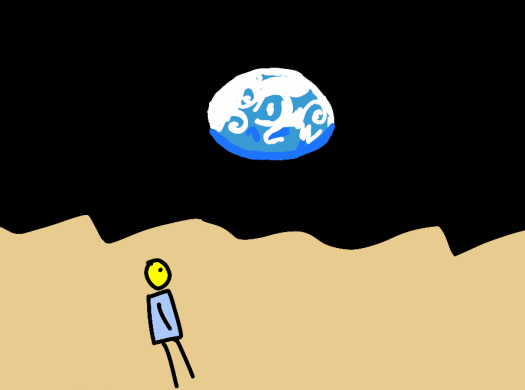
And you don’t get much more different from the moon – imagine seeing an Earthrise the way the first astronauts did.

Unless you travel to the edge of the solar system.

From 6 billion kilometres away the Earth is simply a pale blue dot, the size of a pixel on a screen.

Although most of us won’t get a chance to travel into space, perhaps technologies such as virtual reality and augmented reality can help us have the same experience right here on Earth.

Maybe the technologies we have have created to escape reality can also help us protect it.

How to give people feedback on their eco-behaviour

eco-feedback.png

Many of us assume that if we just give people the information they need, they will act in the right way.

This assumes that households and businesses are run by micro-resource managers who make decisions about how to act after looking at the costs and benefits of all their options.

To change behaviour all we need to do then is provide things like smart meters and everything will be better, won’t it?

It turns out that isn’t the case because there are a number of problems we face.

For starters, not everyone understands the language of energy or water as shown on a display or report.

It’s hard to visualise 140 litres of water, for example.

It may be easier to grasp when it is translated into something that people can relate to – for example a one litre bottle for every child in a small primary school or the amount of water that goes into making one unit of product.

Even when people understand it, they may not feel they have any choice about using energy.

No one wants cold tea – and we would rather wear clean clothes. That means using the kettle and washing machine.

We can’t turn off energy if we have to do things – we have no control really.

A related problem is focusing on visible things and forgetting the stuff running all the time in the background.

For example, using the kettle will turn displays red with a power spike – but it only lasts a small time.

Or many organisations focus on replacing lights, because that is a very visible way of showing that they are reducing energy – but miss out on larger savings.

Then there are traffic light systems – which have been shown to improve behaviour by getting people to try and stay in the green.

At the same time, they make it ok to do things as long as the display is green – consuming more power overall over time.

A major stumbling block is simply what we want. We’d like a bigger telly, even though the old one works.

Christmas is about shopping – and we’re not going to deprive the kids of stuff even if it’s mostly plastic.

All these problems and more mean that getting people to change behaviour is a bit of a challenge.

So, how should we look at solutions? We can take some lessons from the designers of better eco-feedback solutions.

First, we need to provide better information.

For information to work, it needs to be easy to understand, attract attention, have a social component and be provided at the right time – the EAST framework.

An example is making sure there are labels that say when and who something must happen – like a sticker on light switches saying the last person out should turn off the lights.

Then there are goals.

Companies that commit to targets like Science Based Targets will give people the responsibility and permission to take action.

Government targets can ripple through economies and cause changes in behaviour in order to comply.

There is some evidence that comparisons work – people like being on top of league tables, for example.

After a certain point, however, it may not be possible to eke out further savings, and so comparisons become less important as people feel they are impossible to achieve.

Incentives and rewards, even small ones, can affect behaviour.

Simply having a star after the names of people can change how the group views and engage with the activities required – either to get their own star or keep one they already have.

For eco-feedback to work, it needs to follow the Goldilocks principle.

Not too much, not too little, but just right.

What is a smart contract?

smart-contracts.png

We hear a lot about smart contracts these days.

But what exactly is one, how do we create it and when can we use it?

The term was invented by Nick Szabo, who applied his interests in computer science, law and cryptography to create a cyberspace equivalent of gold – and came up with the idea of decentralized digital currency.

The point of a currency, however, is that it acts as a store of value and a medium of exchange – but when do we actually need it?

Nick, in his original article, says a contract is really a set of promises.

The things that go into a contract have evolved over time – from a contract of marriage to a contract of employment, from a contract of sale to a contract of lease.

All these structures say that the people involved promise to do certain things as set out in the contract.

While the concept of a contract can encompass a blood oath sworn at midnight under a lightning blasted oak tree, normal contracts have four characteristics:

  1. The participants can observe how each party is performing on the contract.
  2. An arbitrator can verify that the contract is performing as set out or is being breached.
  3. The only people involved are the people that need to be involved – their rights are secure and private.
  4. The contract can be enforced – for which we need acceptance of the contract by the powers that be.

A smart contract takes these concepts and recreates them in the digital world.

The difference is that parties enter into a digital agreement instead of signing a paper contract.

This has been done several times before – every payment with a Visa debit card, Ebay purchase with Paypal and software contract we sign without reading are all digital contracts.

The idea of smart contracts when linked with Blockchain technology adds a few ideas to standard paper contract.

The first is that contracts can be expressed in code using an algorithm.

Common algorithms may be if-then or when-do.

For example, if you pay me X, then I will give you an hour of work.

Or when a shipment of copper is delivered in two months time I will pay you the price then that we agree now.

So this means that we need to identify the real life elements that the contract talks about like money and stuff.

For example, payments might be done using a decentralized digital currency like Bitcoin or Ethereum while each hour of work or shipment of copper is tagged with a digital identifier.

So, a second part of a smart contract is the ability to give things a digital ID.

Then there is the question of where to store the smart contract – and that’s where the idea of a ledger comes in – especially a blockchain based distributed ledger.

This keeps the information related to the contract secure by design.

Smart contracts are the way things are going to go – paper agreements have little place in the future.

Many other part of a contract – the promises we make, the reliance on the state to enforce agreements, and the lawyers that create and interpret them – are all still likely be around.

The key, however, is going to be to get the contract algorithm right.

What are people really looking for from us?

servitization-model.png

Theodore Levitt, a Harvard economist and professor, said People don’t want to buy a quarter-inch drill, they want a quarter-inch hole.

With larger purchases come greater expectations of performance, reliability and longevity.

An approach companies use to deliver these is servitization.

Servitization is a change in mindset from selling a product to selling a Product-Service System.

Professor Andy Neely from the University of Cambridge is a leading researcher in this area and says that the term has been around since the 1980s.

The classic example here is Rolls Royce.

It no longer sells jet engines. Instead, it sells flying hours.

Rolls Royce now delivers reliability – done through planned and predictive maintenance by analysing data from monitoring systems in the field.

Making a move from scheduled repairs to targeted repairs based on performance data enables fleet operators, from the military to councils, to improve things from combat readiness to bus times.

The way we get media has changed with this approach.

Netflix offers media as a service and Amazon offers ebooks.

Servitization has quietly transformed the software business.

It’s hard to buy a software product any more. It’s all software as a service (SAAS) now.

This is not always a good thing.

Netflix has lots of rubbish on it. The good stuff still needs to be paid for.

We get a million books with an Amazon Unlimited subscription – but the good authors still set their own prices and get committed readers.

Servitization in these cases gives the companies a revenue stream and a customer convenience – but the pressures of controlling costs means that the performance is not superior to just buying a really good collection of books and movies.

And software as a service really all-too-often means self-service software.

So, it’s still a product sell rather than a service when we think about it.

According to Professor Neely, servitization is something of a paradox.

Many firms offer product-service systems, but it makes less money and carries higher risks than we first think.

The key thing is a change in mindset – in how we connect a product, service and performance.

This shift starts with the customer going from wanting to own a product to being happy with a service.

How to think about mining data for value

data-mining-phases.png

Why should we try and use data better?

The short answer is because we can make money or save money using the insights we get from analysing data.

But a more useful answer might be because it helps us see more clearly.

That’s very Zen.

Zen teaches that we normally see the world through a haze – a fog made up of the assumptions, preconceptions and fixed ideas – that is created by our desires.

For example, many people are so involved in the way they do something that they fail to see that the something they do is no longer relevant. Innovation simply passes them by.

Or, if we really want something to happen or believe that an approach is right, we become blind to anything that contradicts that point of view.

The way to see clearly is to look at the world as it is.

This is pragmatic advice, but how do we go about doing it?

The Cross Industry Standard Process for Data Mining (CRISP-DM) is now over 20 years old – but still useful.

There is data everywhere these days, leaking out of sensors, meters, surveys, analysis and social media.

We could analyse everything, but we should probably start with an understanding of the business.

What is special about this particular industry, what is the competition doing, how do customers act and what would the business like to do?

We can then stick our heads in the fog and try to understand the data that’s available – going back to the business to ask questions or get some more.

Is it clean or patchy? Do we have lots of numbers or is it full of words? Is it in an open format or do we need to get it out of databases or proprietary formats?

For example, the way we treat energy metering data is different from twitter comment mining or newsfeed monitoring

A huge amount of work then often goes into data preparation.

The data needs to be bashed and cut and manipulated into a form that we can work with.

All too often, the data preparation takes so long and ends up in another messy form that there is little time left to do any modelling.

But – getting to the right kind of data structures can make the task of modelling much easier.

Models help us create and test theories.

Do we think there is a relationship between variables or a robust way to identify problems?

Then its time for evaluation.

We could do an infinite number of analyses, but we need to focus on the ones that are aligned with what the business needs to know.

Are we providing useful insights that can be used to make the business more effective?

If so, then we can head towards deployment.

There is no point doing analysis once and then forgetting about it.

The law of entropy – things decay over time – means that without management things will simply drift and become worse again.

Ideally, we’d automate the analysis and reports and let people know when things are going wrong so that they can get involved and fix things quickly.

The CRISP-DM is a process we can follow to create a data mining project.

The real value comes from the understanding we get when we see what is actually going on.

Where should we begin – again?

kicking-a-whale.png

Creating something new is usually interesting and fun.

There are no restrictions – we’re focused on the problem at hand – and we can choose from a variety of tools to carry out the work.

Over time we develop processes and workflows that streamline things and make us more effective, especially as we add people to the project.

Things ramp up – we improve quickly – until we start to plateau.

And then we start to move more slowly – as the steps and processes and interactions start to hinder, obstruct and finally block progress.

At this point things aren’t fun any more.

At this point the friction involved in doing anything – the effort that it takes appears overwhelming.

It’s like being asked to kick a whale down the beach.

This happens in all kinds of systems – whether it’s programming, process engineering, or business strategy.

What we already have stops us from moving ahead and getting better.

So… what can we do about it?

Perhaps it starts with a mindset.

Steve Jobs, for example, was famously minimalist.

His house had hardly any furniture in it – perhaps the barest essentials – a mattress, a chest of drawers and a few folding chairs.

His philosophy led to the creation of devices like the iPad, so intuitive in design that a child can instantly use it and without the buttons and controls that others slapped on.

The problem many of us have is we have added too many buttons and features to our lives and working environments – we have too many meetings, follow too many processes and try too hard to please everyone.

What would happen if we spent that time working on interesting and useful things instead?

Perhaps we should begin by looking at everything we do and cutting back on everything that simply doesn’t help us innovate or keep customers happy.

Perfection is achieved not when there is no more to add.

It’s reached when there is no more to take away.

The secret to making money

daily-profits.png

Every real businessperson I have met thinks about money in a certain way.

They break things down into what they cost on a daily or weekly basis and then see how much they need to make every day or week to be in profit.

For example, let’s say we wanted to start a taxi service and bought a car for £10,000 that will be run for 3 years – and it’s going to be worth £3,000 at the end.

A business person will think of that as £7,000 of capital spread over three years to make decisions.

The taxi might be in service 5 days a week, 48 weeks of the year for 3 years – that’s 720 days of operation.

So we need to make at least £10 a day to pay for the car. The stuff on top is profit.

It’s as simple as that – once we are making a profit, however, lots of people will want a bite of it – from the government to helpers.

But the basic principle is still just that simple.

Sometimes the more complex financial calculations that we do – from paybacks to internal rate of return – simply confuse the issue.

Especially when it comes to serious projects that have lots of moving parts.

For example, battery storage plus solar is all the rage now.

Around a year ago I made some notes from a podcast by Barry Cinnamon, who uses exactly this method to evaluate the economics of an battery storage plus solar installation.

It’s from 2016, and prices may have changed, but principles don’t.

We are currently going through an infrastructure upgrade process in the UK that staggering in its scope and scale.

We have ageing networks of wires, pipes, sewers, roads and railways, all of which are being upgraded or replaced.

And there are a myriad projects being chased by developers.

For projects in the energy business – it’s once again pretty simple.

There is a price per kWh of energy – and if we can buy it for less or sell it for more than that we can make a profit.

The problem is when we have very complex financial models that help us buy it for more or sell it for less.

As Theresa May (now probably wishing she hadn’t) said, there is no magic money tree.

But there are many, very real, money pits.

What types of data analysis can we do?

types-of-data-analysis.png

We live in a world where we collect increasing amounts of data – but how many of us do anything with it?

At one extreme, we might do nothing at all, missing out on insights that could make a difference to the way in which we live and work.

At the other, we could create very detailed and sophisticated analyses that either no one understands or work under such specific conditions that they are not terribly useful.

The data out there includes information on customer behaviour, sales activity, operational production, energy use, waste generation – the list seems endless.

So, what can we do about improving the way we go about analysing the data?

An approach summarized by Dr. Jerry A. Smith and attributed to Jeffrey Leek suggests six types of analysis we can do.

We can start by describing the data – finding out more about its shape and characteristics.

How large is the data set? What is the average value? What does the distribution look like? Are there any outliers?

A large number of analyses stop here and go no further.

But what we should do next is explore the data. This means that we look for relationships between variables.

How does one variable correlate with another, or change over time?

For example, a classic use case is to look at energy consumption in relation to the outside air temperature.

Google correlate is an interesting tool that lets us see what kinds of search patterns match real world data.

The warning, as always, is correlation is not causation.

Our next, cautious, step is to see if we can infer something from our analysis to date.

Given what we have learned, can we say something about what might happen more widely?

So given the reactions of a sample of customers, can we be reasonably confident that the wider market will react in a certain way?

The level of certainty we have will make this method flow into the next as we predict what will happen.

At election time, this kind of data analysis always reaches fever pitch. All night analyses, updated with constant data feeds, update and predict the outcome.

Prediction is usually possible over relatively short time scales – we might be able to predict with accuracy the winner of a presidential contest in the next month, but not the winner from a pool of potential candidates five years from now.

Now we have to see if there is a causal relationship between two variables – a change in one will cause a specific change in the other.

This is the kind of analysis that happens in clinical trials. For example, a specific dose of a drug will result in a measurable improvement in a condition.

Finally we can look at a mechanistic analysis or an exact model, where we know what will happen as all the variables change.

This is usually the domain of engineering models – we know that a steam train will operate in a certain way once the water gets up to temperature and pressure and the various mechanical systems start to operate.

In a sense, the various methods of analysis progress from simple to complex.

A complex system – like human beings in a social environment – may only be understood with simpler analyses.

We can predict what someone will do, but we cannot say with certainty that a particular set of input stimuli will cause exactly certain neurons to fire and result in a defined activity.

An exact model may only be possible with engineering systems that operate within clear parameters and tolerances.

Analysing data isn’t something that comes naturally to most people.

We need to work on developing the skills, capabilities and toolkit needed to make sense of data.

And that probably starts with knowing what types of analyses we can do and understanding the situations where we can apply them.

How understanding fractals can help us decide

fractals.png

A fractal is a curious thing.

It is most commonly shown as a pattern, often mathematical, that is similar at different scales.

The Koch snowflake, for instance, is drawn by starting with a line and creating an equilateral triangle by splitting it into three parts.

Then, each segment of the triangle – a line – is turned into another triangle. Then that is repeated again.

What we end up with is similarity at different levels – as we zoom in we see the same pattern repeating itself.

Another fractal that is easier to visualize is a fern, or a lighting bolt.

A mountain is a fractal.

Seen from a distance it has a certain shape. Zoom in and the bumps and ridges are replicated on the surface all the way down to individual rocks and pebbles that show similar shapes under a magnifying glass.

So, what does a fractal have to do with decisions?

There are two ways we often approach decision problems.

One is through fundamental analysis – we look at the long term features of the problem or situation and come up with an approach to deal with it.

In investing, for example, this may involve looking at the stock price, earnings, assets, market sector, historical performance, management team and so on.

Or, in a business, it might involve looking at the accounts or the number of billable hours and making choices on where to invest or how to spend time.

A different approach might be to learn how to recognize patterns.

A price chart often shows similariy at different levels.

Performance during the year, during a month and during a day all show signs of the continuing battle between supply and demand.

Understanding these patterns and working out a logical approach to dealing with them can make the difference between good investment decisions and shooting in the dark.

It might also help us with managing people.

For example, an individuals career often follows a series of ups and downs – starting, learning, growing, plateauing and ending.

A company does the same thing – following a lifecycle.

Whether you look at it over the 40 year life of a company or the 40 year career of an individual, we’ll see similar patterns emerging.

And the way to deal with patterns is to recognize that things happen again and again.

From a decision making point of view, it means that there are very rarely crucial decision points.

We can take it easy – if we miss one opportunity, another will come along in a while.

It’s that whole thing about another door opening when one closes.

The best time to start a new project, for example, is 10 years ago.

The second best time is now.

When should we change lenses?

choice-of-lenses.png

There are at least two problems with how we go about solving problems.

The first is we approach them from our perspective – using the set of strategies, models, expectations, biases, experience and tactics that we have built up over time.

The second is our first attempt to come up with a a solution tends to narrow our thinking very quickly, as we look for patterns, evidence and reasoning to support that solution while forgetting about the rest of the options out there.

It is very hard to stop doing either of these things – it’s an approach we’re comfortable with and when we are faced with a problem – whether it’s doing some DIY or fixing a failing healthcare programme – we tend to fall back on our default programming.

So, can we change this or are we stuck with the way things are?

One technique that may help is problem restatement.

We restate the problem by taking the time to write out the problem again in as many ways as we can think of.

For example, perhaps we have a difference of opinion with someone at work on an issue.

It’s easy to make the fundamental attribution error – saying the problem is that person is rubbish because of who they are as a person rather than the situation they are in at the moment.

But, what if we tried to look differently and restated the problem.

We might be able to use a selection of lenses.

The reverse lens tries to look at the situation from the other person’s point of view.

What would they say about us and the situation and how would they justify their approach – and is there any merit in what they are saying?

The long lens helps us look at things with a longer term perspective.

Will this issue matter in a week, a month or a year?

The wide lens looks that the situation in context.

How does this issue affect everything else?

If it went the wrong way would the consequences be significant or not, and so how important is it in the wider scheme of things?

Restating the problem is one way to increase our chances of getting a good outcome.

As Charles Kettering said – a problem well stated is a problem half solved.