How can we make better decisions in organisations?

decision-process.png

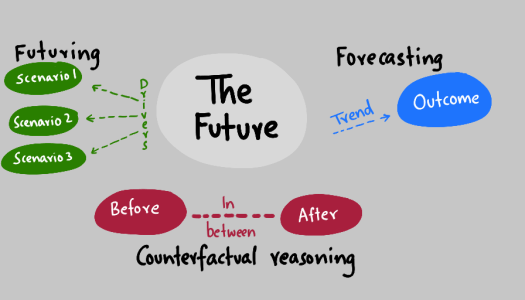
Is the quality of decisions made in organisations any better now than it was fifty years ago?

We have quicker, faster, better technology – but human nature and the way in which we think and act is still unchanged.

Which makes a working paper on Management Information Systems from 1971 by Anthony Gorry and Michal Morton an interesting read.

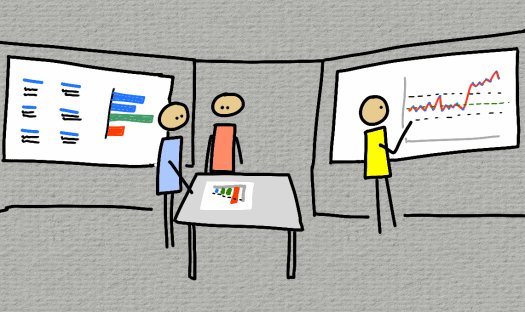
They use a framework for thinking about the kinds of decisions managers have to do.

Managers have to collect information and make decisions at three levels:

  1. Strategic planning: Choices about the future, done in a non-routine and often creative way.
  2. Management control: Getting the best out of people.
  3. Operational control: Making sure tasks are done effectively and efficiently.

Information for strategic planning is outward looking, taking into account market conditions, regulation and what competitors are doing – but is only required when the planning activity is taking place.

Management control is about people – selecting them, keeping them and motivating them.

Operational control is inward looking, focused on what is happening right now – and the information needed to support this is obtained and looked at on a frequent basis.

So, the obvious step is to think that the better the information that we have, the better our decisions will be.

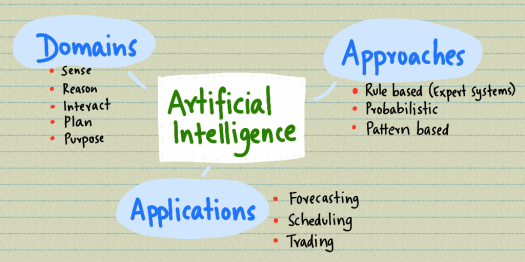
That is the one of the touted benefits of Big Data, Machine Learning and AI – if we get all the data and crunch it, the information that comes out will help us make better decisions, or make them for us.

If we think about a decision process as a black box, with information going in and decisions coming out, surely we can improve the quality of decisions at all three levels by improving the quality of information?

But there are two things we miss.

The first is that different kinds of decisions need different types of information.

Merely collecting all the data that is out there is not the answer – and we know that from nature and biology.

We often think that we see a lot of things around us. In reality, our eyes can only see in a fairly narrow band, focusing on the thing that they are pointing at.

Our brain fills in the rest of the information, so it looks to us like we are seeing a wider scene.

Instead of more data, biological systems focus on a subset of data that is important for the specific situation.

The second thing is that we can also work on improving the decision process, and this starts by recognising that the problems we apply our decision process to can be structured or unstructured.

If a problem is structured – like working out the optimal size of a batch or the most economic schedule – we can collect the relevant data, analyse it, make a decision and monitor its impact using ongoing real-time data.

Many problems however are unstructured or “wicked”.

These can’t be solved simply by throwing more data at clever algorithms.

Instead they need better decision processes – better models that can express the complexity of real world affairs.

This requires us to use human intelligence alongside machine learning and artificial intelligence.

The computers are there to support us – not think for us.

Not yet anyway.

How to analyse the future

analysing-the-future.png

Thinking about the future is not easy.

As humans we fall prey to biases, and two in particular are important.

The first is hindsight bias where, looking back, we think that things that have happened were far more inevitable than they actually were.

For example a Trump victory seems like it was pre-ordained now – Hillary never stood a chance against the Twitter machine.

At the time, however, not many around the world seriously thought Trump would win.

The second is foresight bias – we believe some things are more likely to happen than others and so bet on them more heavily.

We need tools and methods to guard against these biases and reason about the future more effectively – and the military and intelligence establishments are a good source of information on these.

For example, this guide sets out a detailed approach to counterfactual reasoning, one of the tools every analyst should be able to use.

When we think about the future we often do one of two things.

1. We look at trends

We see trends and infer outcomes that result from those trends – a technique called forecasting.

For example, we might see a trend towards decentralised currencies with bitcoin or a trend towards widescale adoption of solar photovoltaic and distributed generation.

We forecast an outcome based on these trends – the end of traditional banking or energy firms.

2. We create possible futures

We do futuring when we look at drivers and come up with possible scenarios that might result.

For example, the widespread use of mobile phones will make desktop or offline services less relevant for things like getting media, checking mail and reading the news.

Counterfactual reasoning

Counterfactual means counter to the facts, and we reason that way by asking questions like “What if” or “If we”.

We can look at a problem in terms of antecedents and precedents – or before and after a fact.

Approaching a problem in this way has two benefits – it helps us explore cause and effects and it lets us be more creative.

For example, take a statement like the fall in the price of solar panels means that we will have widespread adoption in residential neighbourhoods.

That seems like a perfectly reasonable statement – but what happens if we break it down?

Should we start a solar panels sales business right now?

The before bit is a fall in the price of solar panels – which we see happening right now.

Cheap solar panels clearly lead to cheaper costs for the equipment.

But, does that alone justify the conclusion about what comes after – widespread adoption in residential neighbourhoods?

It does not – because we haven’t looked at the components in detail.

First, we need to examine why prices are low. Is it because the technology is getting better and cheaper, or is it because massive capacity increases in China are resulting in panels being dumped on the world market?

Then we need to think about the in-between – what may happen if what we predict takes place.

Low prices for panels don’t get around other problems – such as the connection constraints in neighbourhood, the other costs of installation such as scaffolding, and the possibility that high demand for installations coupled with low numbers of qualified tradespeople after BREXIT may result in bumping up the costs overall.

Then there is the after – new homes are very likely to have panels fitted – they can be designed in.

But will there be a rush by homeowners to retrofit panels or will they be put off by the up front cost and possible impact on sale prices?

If existing homes are slow to change, the overall rate of change will be slow because existing housing stock stays in place for decades so for everything to be replaced with new energy-efficient housing could take a century.

Summary

We can jump very quickly from what we see now to what we think will happen in the future.

The purpose of using analytic methods in a structured way is to help slow us down and examine the situation in more detail, coming to a more considered view on what may happen.

The conclusions we come to as a result may help us make better decisions.

What we should do before investing in technology

technology-impact.png

We often think of technology as a good thing – surely having the latest version of something is obviously the best way and people who do that win?

Perhaps not.

Charlie Munger said – The great lesson in microeconomics is to discriminate between when technology is going to help you and when it’s going to kill you.

Most companies would benefit from new production technology that is more efficient and so uses less energy.

The deciding factor, however, is what that technology does for the business

Does it help it create more products, for example.

In a commodity business, being able to push more product out means that the market has more supply and so prices go down.

The cost and energy savings made by the more efficient technology is wiped out by the reduction in prices to customers.

All of the benefit goes the customer, with little staying with the manufacturer.

The Japanese are well-known for having slow upgrade cycles, using older equipment for much longer.

This is because changing things adds complexity and could reduce the amount of time the factory actually operates.

In addition, changes often introduce new problems, and Japanese companies value stability and continuity.

They invest in systems that help them reduce defects, by continually monitoring a number of parameters and warning them when things are going wrong.

This helps them maintain quality.

Having good monitoring systems lets workers manage more systems and machines each – while good working practices, maintenance regimes and stable technology let operations carry on without crisis or constant intervention.

All too often, we look for a silver bullet – a new technology solution that will solve all our problems.

We should start, however, by making sure that we are using what we already have well – and good monitoring systems are our eyes and ears into the operations.

It’s simple really – we need to do the basic things a little better, every day.

And that starts with looking and improving what is in place before buying something new.

What type of service model do you have?

types-of-service-models.png

The UK economy is dominated by the service sector, which makes up more than 80% of GDP.

Many industrialised countries are in a similar position, moving away from raw material extraction and manufacturing to an economy based on service and, increasingly, knowledge based activities.

How should we think about service businesses?

We often start by thinking of a service as something people do for other people but this doesn’t capture the full picture.

In 1978 Dan R.E. Thomas, writing in the Harvard Business Review, suggested that we need to ask two questions to understand the model used in a given service business:

  1. How is the service rendered?
  2. What equipment or people render the service?

Matching services with business models

Although the article is old, it can be adapted into a framework to help match services with business models.

On one axis, we can think of people and their skills, ranging from relatively unskilled to professionals with extensive qualifications.

On the other, we set out how they use equipment and whether it needs to be operated, monitored or can be automated.

Services that require a human operator range from mowing a lawn, which can be done by someone relatively unskilled with a mower, to heart surgery, which requires a team of professionals with specialised equipment and facilities.

Monitored services can range from overseeing equipment, such as a car wash to more complex plant operations and consulting services.

In these situations the people don’t need to get physically involved but use systems to keep track of operations and change settings as needed.

Automated services range from vending machines at one extreme that have a fairly straightforward task of dispensing products to expert systems such as a health website that allows us to diagnose ourselves and decide whether we need to go to a hospital or not.

Why knowing the kind of service model you have is important

The kind of service model we operate decides how we scale the business.

If a business depends on one person’s time to succeed, then scale can only happen by adding more similar people.

Think lawyers, accountants and management consultants.

There is a reason why most professional practices are small.

They can only grow by putting in more capital and pushing up their fixed costs base which, if revenue fails to grow as expected, means they eventually slide into failure.

There aren’t that many ways to get around this. A common solution is to find patrons – small or big.

Scaling equipment, on the other hand, may be an easier option.

As more of the service is automated, the same number of professionals can deliver a better service to customers.

Unless it spills over into self-service.

There is a crucial difference between service automation that makes things better and cheaper for users and service automation that makes things better and cheaper for providers.

Getting users to do more of the work can easily fall into the latter category.

The right blend of service and equipment

A good service business, it would seem, has a core of people with appropriate skills and scales by adding technology and automation that improves service quality to customers before adding more people.

As with most things, that’s easy to say, but not simple to do.

How to create the conditions for complex outcomes

elephant-more-than-sum-of-parts.png

The natural world is teeming with creatures perfectly adapted to their environment – that have ways of walking, swimming and flying, live alone or in social groups and participate in an ecosystem with their own unique niche and capabilities?

Where do we begin trying to understand how they do it?

We start by breaking things down into parts that we can understand.

Like blind people touching parts of an elephant, we find pieces – a snake-like tail, a fan-like ear, a tree-like leg.

If we bolted a snake, a log and a fan together with the other bits that we identified, would we get an elephant?

The answer is clearly no – but we persist in trying to build complicated things from simpler pieces.

Take most systems, for example.

An organisation is a system made up of people in roles.

There are some at the top who see themselves as the brains and controllers of the outfit and many people who do work.

Organisations are often designed – made up of structures and hierarchies and reporting lines – held together and moved in a particular direction by incentives, punishments and guidance.

Does organisational behaviour come from the particular arrangement and positioning of people?

Or does it emerge from somewhere else?

The study of emergence looks at how complex behaviour arises from the interaction between simpler elements.

There is a difference between complex and complicated.

Complicated may be something like a steam train – with lots of moving parts. When the parts move in the way they should, we get something complicated like a moving train.

An example of a complex thing is a flock of birds flying in the sky together. Each bird maintains its distance from another – and the whole flock can swoop and move like a single living thing – but there is no one bird that plans or controls the action.

The complex thing that we can relate to easily is the Internet.

We are all connected by a vast decentralised network that has only a few simple rules about pages and links – but is so much more than that now.

Emergence is sometimes seen as the border between order and chaos.

In an ordered world, everything has its place – we put a rock on top of another rock and eventually we can get a building.

A chaotic world is dynamic – as elements combine randomly with feedback to create new conditions that – and range from the weather to swirls in a coffee mug.

As we move from order to chaos – we pass through emergence – and that is where life and the behaviour we see in the natural world seems to be.

But how can we use this in daily life or business?

With knowledge work in particular, a strict rules based approach is unlikely to create anything particularly interesting or innovative.

Instead, its the interaction between people with capabilities working together that creates output from the organisation that is “greater than the sum of its parts”.

Managers should try and do just a few things.

  1. Find good people.
  2. Remove as many barriers as possible that stop them working together.
  3. Set a few working practices
  4. Get out of their way.

Then, wait to see what emerges.

Why we need to get tactile with data

obeya-tactile-data.png

We often put a lot of effort into creating a good looking dashboard or reporting system – but then what happens?

All too often it simply becomes background noise.

We get it every day and ignore or simply tune out – going blind to it while we get on with whatever is latest and loudest.

We tend to fall into patterns and things like data and information displays can simply become pretty pictures rather than being used for reflection and action.

Unless you work in a lean organisation, that is.

The Japanese have a word for a big room – Obeya – that they use to call a dedicated space that is where people come together, can see what is going on and collaborate.

A way to think about this is like a command centre, a war room or the bridge of a ship.

Japanese companies like Toyota use this every day – or even several times a day.

It starts with a simple idea – we have to hit certain targets every day.

We get together during the day and go through the numbers and see if we are on track or not.

If not, we can make changes and correct our course. Being in the same space helps with having that conversation.

The space doesn’t have to be physical – it can be a digital space where we can get together, share and modify information.

But the important bit is that we need to engage with information we get.

At Toyota they make updating information a manual activity – writing numbers by hand, drawing charts and updating status indicators.

It’s the process of interacting with the data and information we have in front of us – of trying to touch and feel it – that transforms it from being a pretty picture on the wall to the source of our next action.

We are more engaged when we understand what is in front of us – and that makes for better conversations and more useful collaboration between colleagues.

It’s interesting that as we have more and more powerful ways to dissect and distill the data around us we humans become the bottlenecks in being able to use the information and insights more effectively.

And that’s no bad thing – constraints are good for innovation.

If anything – we need to slow down even more.

We need to look beyond the dashboard as a result and focus on the end result – what are we trying to achieve each day?

We should get our fancy algorithms and computers to do the number crunching they are good at and give us the figures we need – that’s not work people should do.

Our job to use our time to get a feel for the numbers – getting tactile with them.

That frees us up to use our creative ability to come up with solutions – and we need all the creative time we can get.

Because there are a lot of interesting problems out there to solve.

How to use Lean Data to get better feedback

lean-data.png

We need feedback to improve how we do things – but what is a good way to get it?

At one extreme in the feedback spectrum is Big Data – if we collect as much information as possible and feed it into clever machines that can learn and have artificial intelligence (AI), we’ll get deep insights into customers, organisations and systems.

At the other extreme is the collection and processing of information that seems important to people that matter – bosses, shareholders and government.

These focus on output metrics that are important.

In local government, for example, the number of jobs created is the main question asked of any project and so, unsurprisingly, most proposals will bump up the number of jobs projected to numbers that may never be realised.

The Big Data approach has a barrier to entry made up of knowledge and systems.

The output based approach makes the numbers look good but may not reflect reality.

So, is there a middle way that is simpler and cheaper to do?

Sacha Dichter and Tom Adams at Acumen, a non-profit that looks at innovative ways to reduce poverty, and Alnoor Ebrahim at Harvard Business School have used a new approach to measurement that combines lean design principles with quick and inexpensive data collection methods that they call Lean Data.

Lean data has two goals:

  1. Make measurement cheaper.
  2. Increase the value to enterprises of collecting data.

In the non-profit sectors that Acumen studies things change quickly, there is little money, there isn’t anyone in the organisation with deep data experience and the systems to collect and keep data aren’t there.

These problems aren’t limited to non-profits, however. Virtually all organisations will face the same issues.

Acumen have come up with an acronym – BUILD – that we can use to create a measurement system that works.

Such a system will be:

  • Bottom Up: created after listening to customers so that it addresses what they need.
  • Useful: What comes out of it helps us to make decisions.
  • Iterative: We won’t get it right first time – we need to iterate and continuously improve it.
  • Light touch: We need to be able to use cheap tech that needs little time or money to get going.
  • Dynamic: Things will change – and we need to be able to change as they do.

A problem with many management systems is that although they are designed around principles of test and learn and continuous improvement, they quickly degenerate into compliance activity with box ticking and paper processes that don’t match the real world.

A truly lean approach may help us cut through that and look at the underlying reality with fresh eyes.

We are certain to improve performance if we improve the quality of feedback.

Why we find it hard to make decisions about the future

discounting.png

One of the oldest and best known proverbs is a bird in the hand is worth two in the bush.

This way of thinking is so ingrained in us that we accept it unquestioningly.

We give more importance to what is happening now than what may happen in the future when making decisions.

The simple instance of this is that many people will take a small reward now, say £10, in preference to a larger reward in a year’s time – say £20.

Given a choice between waiting a year for £10 and two years for £20, they will often choose to wait the two years – what’s the difference between a year or two?

It’s a struggle to pass up chocolate now to avoid the weight gain that may accumulate in a year’s time.

This way of thinking is endemic in business.

Managers spend a lot of time focused on the short term – cutting costs and deferring spending now to protect short term results.

In the long term the costs are almost always higher as we take action then only when compelled to by a failure or catastrophe – at which point we are forced to pay whatever it costs.

The economics of this approach is summed up in a term called discounting.

We discount the future – on a linear basis for accounting, on an exponential basis for investing and on a hyperbolic basis (possibly) for impulse purchases.

Let’s spend that money on a new telly now because putting that money in a retirement pot is so much less appealing.

Our future self, sat in a retirement home, will appreciate that telly so much more when sat waiting for the weekly visits from our family.

But that’s simply over-dramatic. We could die tomorrow – we should enjoy things while we are still around.

But we probably won’t die tomorrow.

In many parts of the world the chances are that we will live longer than previous generations and, for the first time, we may be poorer than our parents when we grow old.

Future generations will think up new ways and come up with the technological solutions they need, so we should put ourselves first and the earth could be destroyed by a comet at any time.

Except we can be pretty confident that a future will arrive – and if it’s accompanied by climate change on a vast scale – the amount of investment and technology required to deal with it may be beyond the capabilities of those future generations.

Think about it this way – a discount rate of 5% over 500 years results in a number that looks like this: 39,323,261,827.21.

That’s 39 billion, give or take a few 100 million.

A pound we spend now on ourselves, at that rate, would be worth £39 billion to someone 500 years from now.

That perhaps still doesn’t compute…

The point is that the decisions each of us makes now impact the lives of billions of people some time from now.

We need to try and make wise ones.

What is Artificial Intelligence and can we use it yet?

artificial-intelligence.png

Artificial Intelligence (AI) has been just around the corner for a long time – but looks like we have now arrived.

Computers can beat us at Chess and Go and respond to voice commands.

Navigation systems are so good many of us now have never really learned to use a map.

There are so many ways of looking at and classifying the field of AI and machine learning that it’s almost impossible to get a sense of the field.

But we can start by looking at some broad domains – what do humans do a lot of the time?

We sense things – taking in vast quantities of visual, auditory and tactile information and responding to our environment.

We can detect the edges of things, work out which way is up or down and work out what is near us and if we are going to bang into them.

A particularly human thing to do is reason. Our brains are essentially prediction machines – we can think about what has happened and use reasoning to work out what we should do next.

But we don’t exist in isolation – as social creatures we interact with others – listening, speaking and responding.

We make plans – choose between alternatives or options – that range from what to eat to how to get somewhere.

We are also teleological – the conscious part of our brain helps us do things with purpose.

Our brains have evolved to be the way they are – but how would we go about creating an artificial one?

We could start by writing down all the rules we follow.

For example, doctors get to a diagnosis by considering and eliminating possibilities based on the symptoms they see and the measurements they take.

Rule based or expert systems take all this knowledge and use it to create if-then rules – if the temperature is above X, check Y next.

These systems are now pretty effective – and help us select the best flight, the cheapest online store for an item and schedule calendar entries from text in emails.

If there is too much data and variation to come up with rules, then we might use probabilistic approaches.

For example, we can run weather simulations that are probably accurate over hours or days but less so over weeks and months.

We can look at the distribution of a time series and use that to predict the range of probable future values – which then lets us pick out values and events that fall outside expected levels.

The rule based and probabilistic approaches are pretty easy to build and many systems in use now will be based on them.

A more complex approach is pattern matching, where a learning algorithm adjusts itself and learns from the data that goes into it.

For example, every time we type a search term into Google, we are training its AI engines. If we type in the word “eagle” and then click on a picture of an eagle, Google can learn what eagles look like and eventually predict that a picture contains an eagle.

With pattern matching, the more information we have the better our algorithm gets – and so it’s a winner take all situation where the systems we interact with most will learn the most and pull away from the rest.

But where can we use this technology now?

Three areas that are of interest in the energy sector are forecasting, scheduling and trading.

The energy system is all about balancing supply and demand, whether at the grid level or the domestic level.

If we know when the wind is going to blow, then we can make a call on the number of fossil fuelled power stations we need.

If we can see when demand or prices are high, we can schedule when we do work to avoid costs or take advantage of high prices.

We could even trade between ourselves – selling or buying electricity from the grid or a peer-to-peer network for a profit.

An interesting thing that happens with AI is that as it gets cleverer we tend to dismiss the things it does as simply something a machine can do.

As a result it is quietly augmenting how we do things without us really noticing. For example, how many of us now choose a different route based on Google’s recommendations first thing in the morning?

Many AI applications will be almost unnoticed, simply transforming the essential building blocks of our economic system.

Eventually, one hopes, AI will free humans up to do more creative fulfilling work and leave the mundane to the machines.

How to take a planetary health check

planet-vital-signs.png

How do we know if things are really getting hotter? Is the Earth really running a temperature?

NASA can answer that. They publish annual data on global temperatures and climate trends that can give us an idea of how things have changed over time.

Take carbon dioxide, or CO2 for instance. Since 2005 the concentration of CO2 in the atmosphere has gone by nearly 8%, from 378.21 to 407.62 parts per million.

CO2 has gone up and down over time, but in the last 400,000 years it has stayed below 300 parts per million – but the current levels were reached in the last seventy years or so.

The global temperature rise seems pretty benign – just up 0.9 degrees.

There is consensus, however, that a 2 degree rise is too much, a 1.5 degree rise would help us survive and much more than two would lead to climate catastrophe.

There still isn’t too much urgency it seems.

That’s perhaps because we’re focusing on the wrong thing.

The amount of sea ice is falling dramatically. The rate of change led James Lovelock to suggest in 2007 that the Arctic could be ice free in 15 years, while the IPCC thinks it could be more like 2050.

Whenever it happens the point is that all the sun’s energy pouring onto the Earth that causes the ice to melt conceals the true warming going on.

It takes a fair amount of energy to turn ice into water and all that ice also reflects heat back into space. With the ice gone, dark sea water will absorb the energy much faster.

So, sea level rises could be a better measure of the extent of warming – with some coming from melting ice but a lot from the expansion of water as it heats up.

The effects of this warming trend are unpleasant – and include droughts, hurricanes, crop failure and insect outbreaks.

It’s also not at all certain that we can stop the trend – in a complex feedback system like the Earth once a trend starts it will only stop when a new equilibrium has been reached.

Any action we take now may be too late.

Conversely, some actions that seem positive may be harmful.

Reducing haze that results from pollution and creating clearer skies may allow the sun’s rays to pass straight through and deliver more heat.

Despite this – the facts are that the planet is warming and that is going to have an impact on the way we live around the world.

We need to do what we can because, as Dee hock said it’s far too late and things are far too bad for pessimism.