I think frugality drives innovation, just like other constraints do. One of the only ways to get out of a tight box is to invent your way out. — Jeff Bezos
In these first few posts, I’m going to fumble my way around a video making process that works for me.
I’m also trying to figure out a workflow where AI helps and augments what I am doing, rather than being a replacement, or a dull and sanitized average that isn’t worth your time reading.
So here’s my starting approach.
Think about the content and create a through line
Practice saying it aloud and seeing if it works
Record a one-take video of the content. Only re-record if it’s really bad.
Trim and upload to YouTube
Then, it’s how to share the material.
My usual WordPress flow of org2blog doesn’t seem to work well with video, so I’m typing this straight into the WordPress editor.
Now, for AI.
I’m using Whisper to transcribe the text of the talk, and then using llama3.2 locally to create shownotes. I’m going to add these below with minimal editing. Feel free to ignore them, but you might like them more than the video! In which case let me know.
Cheers,
Karthik
AI Generated summary below
Summary: Ideas for Creating Video Content
The speaker aims to create video content focused on explaining ideas and concepts, rather than entertaining or visually building up an idea. The key goals are:
To focus on the core concept and keep it simple
To understand a particular message in detail
To stay on one particular idea and maintain a through line throughout the explanation
Choosing Topics
Select topics that are personal and important to the creator, rather than exotic or complex
Focus on explaining theory and then applying practical examples (practice)
Constraints for Improving Focus
Technical Limitations
One-take video to improve clarity and communication of ideas in one go
Limited camera angles and drawing from a whiteboard or annotation tools
Approach to Ideas
Two levels: theory (overall umbrella of ideas) and practice (hands-on application)
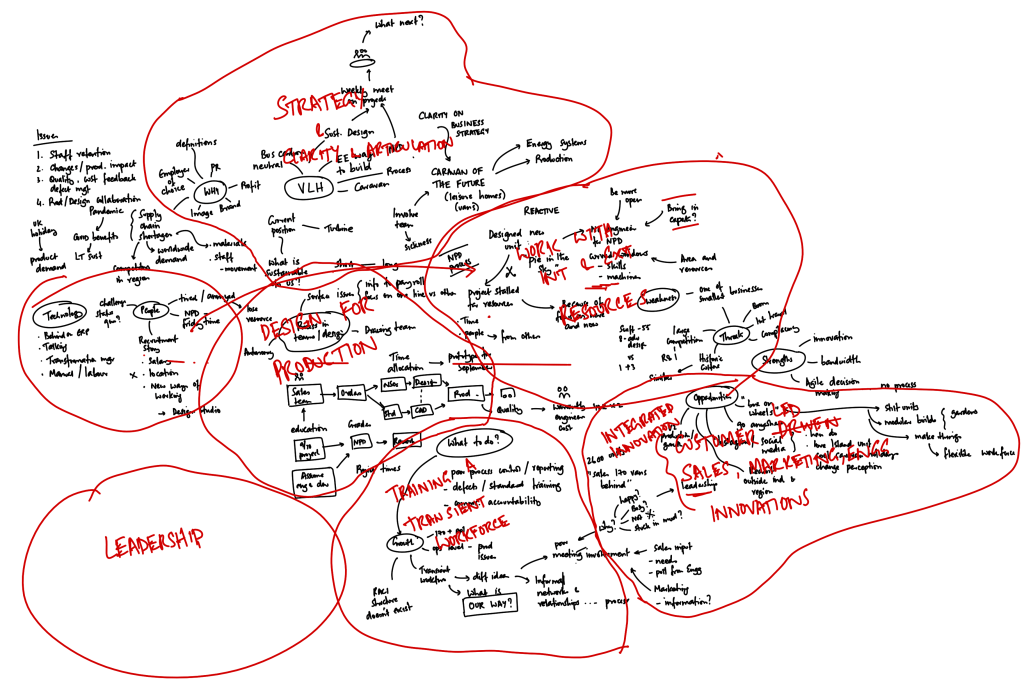
If you haven’t come across Rich Notes before, they look like the image above.
I make rich notes in my work nearly every day, to document and facilitate meetings with prospects, clients and colleagues – especially if we’re trying to work through something complex and multi-faceted.
They are notes taken by hand mostly using digital tools such as paint software and a graphics tablet.
The content includes text and images.
The structure is non-linear and non-hierarchical.
They are made using rich structural elements such as branches, processes, and lists.
They follow conversations, capturing what people say – or their narratives.
What makes rich notes different from tools like mind maps is their rhizomatic structure – a term from botany.
A tree is not rhizomatic. It has a structure that starts with a trunk, divides into branches, and keeps splitting until you get to the leaves.
Think of it like a top down approach that imposes structure where it grows.
A rhizome grows horizontally, with stems and roots growing off various nodes.
Rhizomes can interconnect at different points. If a piece breaks off, it can grow on its own.
It spreads out, growing around obstacles.
In the social sciences Deleuze and Guattari first used the rhizome as a metaphor to argue that the non-hierarchical, non-linear structure of a rhizome provided a richer way to understand social phenomena such as philosophy, linguistics, science and politics.
They talked about a rhizome establishing connections between signs, power organisations and circumstances.
In any situation you have multiplicities or dimensions and they talked about the need to flatten everything on the same sheet – lived events, histories, concepts, individuals, groups, social formations.
This again resonates with taking rich notes on a single infinite flat sheet.
Taking rich notes helps you get an understanding of a situation in all its detail, but what happens next?
That’s for another video.
—
This post is a script that I worked on for a recent talk. If you want to listen to the presentation I recorded, see the video below.
Writers – we’re always looking for that magic method
There’s nothing writers like more than reading about other writers and how they work. Maybe if we copy how they did it, we’ll be able to write like them too. I have a shelf of books on writing – and I’m always on the lookout for more. Maybe one day I’ll come across the perfect book, that tells me exactly how to get the perfect words on the page. In the perfect order.
While I’m waiting to find that book I make mistakes all the time. I open a new file and start writing, stacking sentences one after another. I weave in my worries about writing with the content that I’m writing about. Eventually I have a collection of sentences. If they’re for a blog post, I hit publish. And then I move on to the next piece.
If you’re a writer, then you’re going to write because that’s what you do. It’s the way you make sense of the world. If you write about what interests you, then it’s easy to define your audience – it’s you. Writing for yourself is the easiest way to begin. If you write for someone else, that requires you to know them. And that takes time. It’s a bit like making software – often the best software to make is one that “scratches your own itch”. If it works for you then it may work for others. If you’d read it, perhaps others will too.
Through writing, you make something that lasts. So make stuff. Write. Publish. Make videos. That’s the problem with just talking – once you’ve said the words they disappear. Make what you think exist outside you.
This is easier said than done.
Planning is better than failing
The problem is that making something gets complicated very quickly if you don’t have a plan. The more things you have on the page, the harder they are to organize. A document gets unwieldy very quickly. For example, you can order four sentences in 24 ways. Seven sentences? 5,040 ways. 16 sentences – nearly 21 trillion ways.
That’s one of the attractive things about large language models. They’ve got the computational power to take a collection of sentences and order them based on how likely one is to follow the other. That may be useful to speed the process up, but I also worry that offloading this part of what our brain does may not be a good thing. It’s one thing using an electric saw to cut down on the manual work of cutting a lot. It’s another using your brain less.
Now, before you read any further, I think the best piece of writing advice I have come across is Jordan Peterson’s “Essay”. It’s a very prescriptive approach to writing a good paper. I have referred to this document more than I have all the other reference books that I have. There are specific details that many books do well, but this short guide is the best prescription for just getting on and writing a good piece that I have seen.
But I think there are a few small additions that will help me with my own writing. So that’s what I’m doing in this post – jotting down a few reminders so that my future self can spend less time reading about writing and more time just getting on with the job of writing. I forget things quickly, so I hope this helps me the next time I put pen to paper. Or, as you will read shortly, put the pen and paper down and turn on the computer.
Here we go.
Have you done enough research?
If you’re have trouble getting started, the chances are that you’ve not done enough reading yet. There is more material than ever on every topic out there. But it’s not easy to find, even in a world of Google and AI. What comes up first is rarely what you need. You have to keep digging – there’s much more useful content in journals, newspapers and magazines – the places where you have editors and writers working to create useful content that people are willing to pay for. The stuff on the Internet is unfortunately just not good enough. With the exception of Wikipedia.
The trick when taking notes is to write what you think about what you’ve read in your own words. Add academic references, if you need them, as you go along, or link to relevant websites. Another useful trick, which I believe comes from McKinsey, is the dot-dash method, which is a bulleted list that looks like this.
This is your general point, and it starts with a bulleted list with a dot
Each point below the top point is supporting evidence, a number or a fact.
Each of these starts with a dash
Don’t bother with paper notebooks because it’s a pain having to type up your notes later. Put them into the computer as you go, or tap them into your phone. Whatever you do, make sure that you use the native application on your device. I wrote something the other day on Dropbox on the phone. Then I lost it because I think I closed the app. Write on the native app on every machine. Copy the version across when you need to work on it on a new machine. Organise your folders to make it easy to find your drafts later.
You can keep your notes in a single file, or use a file for each reference. As with anything else, the more you have in file, or the more files you have, the more complicated it becomes to manage the corpus of information. Yes, you can search as long as the information is digital, but it’s easier if you cut things down as you go. But we’re getting ahead of ourselves.
It starts with bullet points
Now that you’ve done your reading, the next step is to write down bullet points. Work from your notes and what you know about the topic. Some will come easier than others, so it’s worth knowing what you’re aiming for. Say you’re writing a 1,000 word blog post. That’s around 10 sentences of 100 words each, in traditional paragraph structure. That means you need at least 10 ideas, so aim to put down around 30-35 bullet points. Maybe more. But don’t stop at 5. Aim for one sentence per bullet.
Okay, you now have a list of bullet points. Copy them to a new document or at the end of the current one, leaving enough space so you don’t confuse the old list with the new. Then start to organize the sentences. Remember that’s it’s very hard to organize all of them in one go. So the way I start it to look at each sentence and figure out if it’s in the beginning, middle or end of the piece. Start moving sentences around. Treat each line like an index card that can be moved to a different location. Put in headings if that helps with the flow.
What we’re trying to do is reduce complexity. Ordering 35 things is difficult. Ordering 5 stacks of 7 points is easier. Ordering 7 points in a stack in order – relatively easy. Move things up and down until you have what looks like a story. When you’ve finished, you’ll have an outline structure.
Copy the outline to the bottom of the page. This will form the skeleton for your first draft. Put the bullets back on the sentences. This will help to visually separate the text you’re going to write from the bullet points. Now it’s time to write.
Writing the first draft
At this point, treat your document like it’s a typewriter – a machine for making words and nothing else. This is not the time to worry about formatting. I get easily distracted by details about page layouts – which is about text formatting, not text generation. It doesn’t matter what software you use to write as long as you’re spending time writing, not fiddling with settings. Make words. You can make them look pretty later.
It’s ok to have a break every once in a while. These breaks help your brain think about what you’ve done – it’s going to be mulling over the sentences and ideas while you’re taking a walk or having a nap. Give yourself time to work on your piece. I’m usually in a rush, I want to get what I’m working on written and posted. But I have to learn to take my time, because nothing is formed perfectly the first time.
Having a routine helps. If you work at the same place, at the same time, with the same tools, the chances are that you’ll get some work done. However, don’t constrain yourself. Sometimes trying a new approach, a different machine, a different place can help you think differently. Time on task is what matters. If you’re stuck, you can go back to the way things were before.
Editing
I think Peterson’s “Essay” tells you what you need to know about editing. I’ve written about that process elsewhere on this blog, so I’m going to focus in this piece on the first draft and the first edit. After that, everything is about making it tighter and better. And then better still.
I’m the kind of person that likes to hold on to what I’ve written. This is odd, because I have no such interest in holding onto material things. I can quite happily throw away most things I own if I had to. So, why am I reluctant to cut sentences – to delete them and forget about them? This has to change.
Think like a sculptor. If you’re working on a block of marble, the figure you’re trying to free is inside the marble somewhere. Each shard you chip off brings you closer to freeing that figure. The shard itself is no longer needed. Treat your sentences that way. Chip away at them and discard the shards – keeping the core that matters. Delete as you go along. If you want, save versions so you can see your progress, a little like taking pictures. You’ll probably never go back to a previous version. Keep cutting away. Be brave. If what you cut was important, it’ll come back to you and you can write it again. Cut away everything that doesn’t advance your story.
Now you have the start of something you can work with. Copy what you’ve done to the bottom of the page and remove all the scaffolding – the headlines and bullet points. It’s time to start editing.
–
Now, I’m going to stop here and post this blog post. I’m also going to upload the pdf of the document behind this post so you can see the steps that led to this version. Now, it’s not like this is finished or perfect – it needs several rounds of editing to tighten before it’s ready to publish in a magazine, for instance. But remember – I’m writing this for future me to start with.
Today’s Wall Street Journal reports that white collar jobs are disappearing as companies are pushed by investors to do more with AI and fewer people. What does this mean for HR?
We know that treating everyone the same hides important elements of strategy when managing groups of employees.
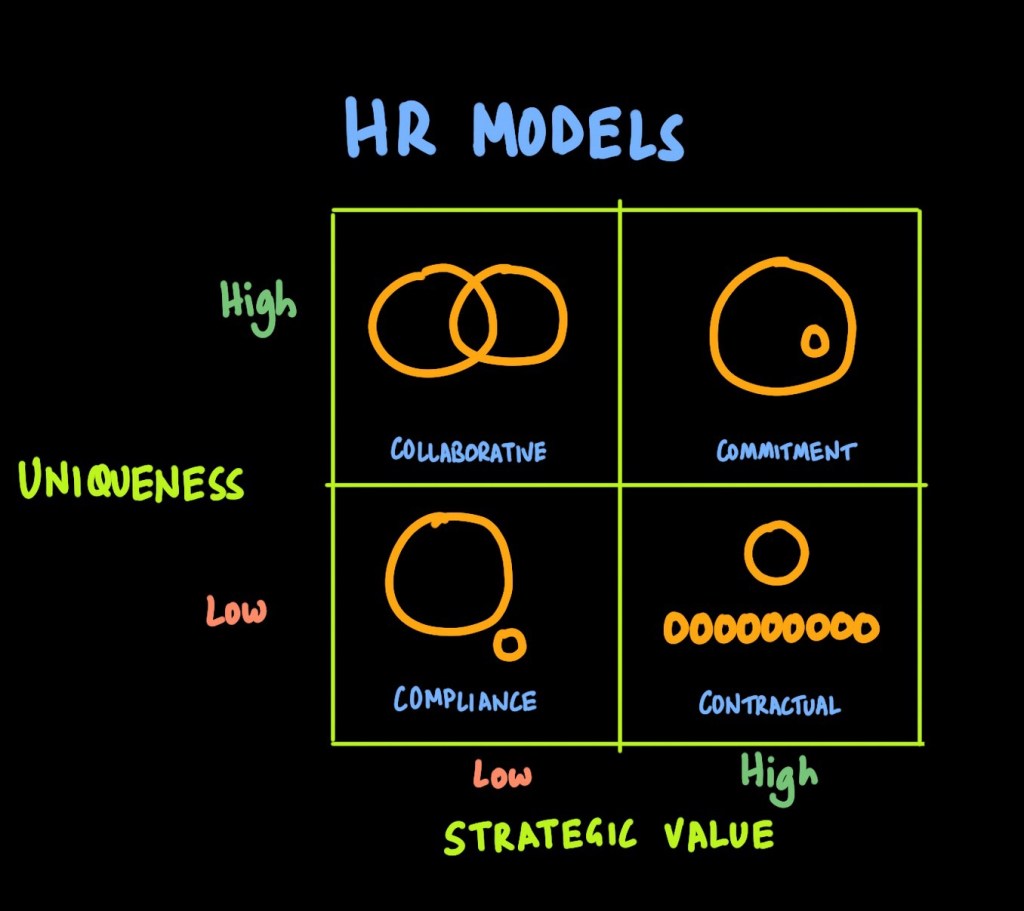
Scott Adams once joked that the reward for good work is more work. Real employment relationships depend on what an employee contributes to the firm – which Lepak and Snell (2002) talked about as the strategic value an employee brings to a firm and the uniqueness of their skill set.
This model is easy to think of in a 2×2 matrix, with uniqueness (U) on the one axis and strategic value (S) on the other.
Low U – Low S: COMPLY
These are standard jobs – janitorial, maintenance, basic admin – where compliance based HR works best. AI isn’t taking over blue collar jobs anytime soon.
Low U, High S: CONTRACT
These are core operational roles with clear deliverables
These are the ones that investors want bosses to sort out – get the same number of people or fewer doing more work using AI.
This quadrant is at highest risk of being displaced by AI and automation
High U, Low S: COLLABORATE
When there are things you need to get done but are not part of the core strategy of the business, it’s time to look at outsourcing or collaborative models. This is where consultants come in. We can support the business to get things done while not being on the permanent hires list.
Although these services are not directly at risk from AI, consultants that don’t use AI will have a higher cost base and so should really be thinking about their own staffing. At our carbon reporting firm, for example, we have AI developed tools that are doing work that we’d have hired a team of 4-5 to do as recently as two years ago.
High U, High S: COMMITMENT
The core, vital tasks that only a few people can do are the ones that are safe in a company. These individuals need to work within a commitment based contract – where they are dedicated to furthering the growth of the firm and happy with the rewards they get in turn.
AI is coming, however, for these roles – and we may end up with smaller and smaller core teams that outperform because they use AI to help them.
HR is usually seen as protective.
In an AI age, companies need to remember that it’s also a core strategic function, and companies that work out how to manage a mix of employment modes are more likely to succeed.
REFERENCES
Lepak, D. P, Snell, S.A. (2002). Examining the human resource architecture: The relationships among human capital, employment and human resource configurations. Journal of Management 2002 28(4) 517-543.
Your customers are the lifeblood of your business. Their needs and wants impact every aspect of your business, from product development to content marketing to sales to customer service.
— John Rampton
I’ve got sales on my mind. I run a business – well, actually a couple of businesses now.
I dropped out of a PhD to join a startup twenty years ago as their first employee. Three of us in a small room. We grew to thirty and were acquired eight years later. I spent a decade in a corporate environment, and now am back to the startup routine, which is where I’m most comfortable.
That journey taught me a lot about building a business. In a startup you’re responsible for everything. Back then I was building computers and putting in wiring for servers. Now, you just start a Microsoft or Google workspace subscription and everything you need is up and running immediately. Infrastructure is not a problem.
Sales, on the other hand – there’s the real challenge. Sales isn’t magic – it’s a craft. One that you have to learn just like you learned everything else, with repetition and focus. So I’ve spent a little time today going back to basics. Reading the classics. And here’s what I’ve found.
Paul makes a distinction between founders and managers. Titles like CEO or COO mean nothing in a startup. You don’t have the ability to give your team instructions and then go golfing. You’re a part of the team – not apart from it.
You feel different when you introduce yourself as a founder, rather than a CXO or a sales person. It’s life or death for you. And you should approach it with that attitude. Seriously and with purpose. This matters. And if you really believe that, your prospects will see it too.
Commit, connect and collaborate
But what should you do – how do you spend your time? Three words: commit, connect and collaborate.
PA Consulting carried out research that found that professional services firm partners fall into one of five profiles. Only one of them is a rainmaker – that rare breed of person that brings in business to the firm. They called this profile the Activator.
An activator commits to building his or her network, connecting with people at different levels of an organisation. They know that a single contact is a single point of failure. As a result, they learn more about the company’s strategies, issues and needs.
Armed with this knowledge, they can collaborate with others to create products and services their clients truly need.
Engage on their time, not yours
B2B sales have changed since COVID. Everything starts with reaching out – but it’s not about cold calling or emails and relentless follow ups. I remember reading a line from a cold caller that said once a person was on their list, they stopped getting calls when they bought, or when they died. It’s a good thing that kind of thinking is dead.
Instead, you have to be where prospects are – which these days means platforms like LinkedIn for B2B consultancy firms like us. And events. And conferences. Places where people come together to learn from people.
The big difference is that the journey is now messy and multifaceted rather than linear and predictable. Lots of touchpoints rather than a funnel. Your content becomes the new cold call. Material that’s there for prospects when they are ready for it – case studies, opinions, videos – on their schedule.
Standardise marketing, not sales
Now this type of reality crashes headfirst into a common thought pattern. Many people believe that things that work have to be standardised, repeatable and teachable. In B2B, however, things are often complex, complicated and confused.
One of the best explanations of what needs to change here is the need to end the war between sales and marketing. The traditional view is that marketing is fuzzy and hard to measure. Sales is predictable and numbers driven.
In reality, we need to reverse this. Marketing is about numbers – put in the work, make connections, share content – and you’ll start conversations with the right people. Marketing opens the door. Sales then figures out what to do in the room – listening, understanding and co-creating the products and services that add value.
And closing the deal.
Learn to surface demand
Now you’re in front of a prospect. How do you talk to them and understand what they need?
Rob Snyder has an answer. His PULL framework gives you one way to structure a conversation.
Start by talking about a Project that they have to work on – one that’s Unavoidable and has to be done. That means it’s important. List the options that the prospect is going to consider. Do they all have severe Limitations? If so, you’ve got a demand signal – they need something. Now you can work out what that is and build it for them.
In other words, if you figure out what a prospect needs – demand – you can provide what they need – supply. It’s basic economics, just the other way around.
Putting it all together
In the end, sales is like everything else in a startup – you learn by doing. Get that right and you’ll end up with delighted customers, and a business that was worth building.
After all, ChatGPT can do it all. It can write a post in the style of someone you want to copy. It can create a coherent and well structured outline of a topic you’re still struggling to get your head around. And it can do it in the time it takes you to make a cup of coffee.
Well, it depends on why you write. And what happens with your writing once you do.
Let’s take a step back for a minute. I started this blog to learn how to write – in particular, how to write in my own voice. That might sound strange – but what it means is that when we first try to write, we use this formal way of putting words down, like there’s a particular way to write that people expect to see. And that ends up with prose that’s no fun to read.
Along the way we read how other people write, and we remember the pieces that talk straight to us. Not pieces that talk to lots of people in vague and general terms, but the ones that take aim directly at us and talk about something we also think is important.
I write because it helps me discover what I think. Until I’ve got the words down, I don’t know what my point of view is on a topic. Ideas and concepts and links appear as the characters form themselves on the page. The act of writing is, for me, an act of thinking.
The world is too complex for your thinking alone to be enough. Lots of people have lots of thoughts, and because we can all write them down and share them now, we’re overwhelmed with words and ideas. And pictures. There are too many pictures. It’s a tsunami of content and our brains are just not designed to cope.
The tools that helped separate the good ideas from the bad ones, like peer review and publication, are straining under the weight of this content. If you’re not part of the academic world you can’t access some of them anyway. Emerging AI tools, however, can go through all the content and bubble up the ideas that are thought of as most important to the surface.
It’s like riding the wave of content in a canoe made of the words and ideas you should pay attention to – the ones that matter most and could be most helpful.
Sitting in that canoe, you can get on with thinking new thoughts that build on the best thoughts that have gone before. Thoughts that aren’t written down yet. Thoughts that are waiting for you to come along and make them real.
Write to think. Write even if no one reads what you write. And most of all, write because you want to.
I was listening to an interview with Seth Godin and he brought up some interesting points about productivity.
First, he defined productivity as:
Productivity is an economic measure of how much you output per hour for the amount of time and resources you put in.
The UK has been talking about a “productivity puzzle” for a number of years. In 2014, the Bank of England said that labour productivity was very weak, around 16% below where it should be.
There are two main hypotheses on why this is the case:
Companies are holding off on firing people because they believe that demand will return, but as there is less demand right now, they are making less per person as a result.
Companies are investing less money into their businesses, meaning that workers are working with old tools and so can do less.
But, I wonder, is this missing the way in which work is changing.
A lot of the work we do now is knowledge work. We can’t build better machines to think better. We just have to start learning how to become more effective at doing the thinking work we need to do.
For many people in the workforce still getting used to digital technology the changes are overwhelming. There is a torrent of stuff coming at them, emails, twitter, video – all kinds of things that just take up time.
We still try and manage the complex work involved in businesses that do knowledge work by having meetings, talking to each other, spending hours moving around in cars to meet people face to face.
How is that productive? While you are doing all that talking and moving, nothing is actually being done that is of any use to anyone.
One company is doing things differently. Automattic runs its billion dollar company with no offices.
Automattic is a totally distributed company, so everyone works from wherever they are in the world. It could be a coffee shop, it could be their home, it could be a co-working space. We hire people regardless of where they are.
And also
The “Automattic creed” states that communication is the “oxygen” for a distributed company.
Matt’s view is that skill in writing represents clear thinking. If I can become a better writer, perhaps I can become a better thinker.
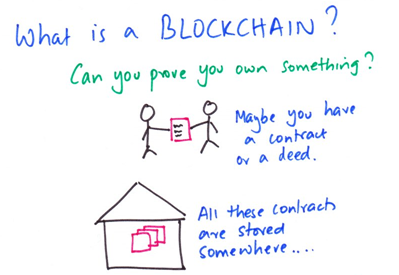
The first few explanations of blockchains that come up when you search for the term seem incredibly complicated.
So, what is it and why should you care? Here are some notes to help.
Blockchain is the technology that makes the virtual currency Bitcoin possible.
It has created the ability for people to create a currency and buy stuff with it without going through a bank, completely bypassing the existing financial system.
For example, if you want to agree a contract with someone, buy a house or just pay for a snack, you are agreeting a transaction with someone else.
To seal the deal, you will have to hand over some money, or sign a piece of paper. That is the evidence the transaction took place.
The records of that transaction are kept in banks, land registries and big paper files. When you want to transfer money or property, you ask the bank to send money or hand over the deed to another person.
The problem starts when record keeping is bad or can be hacked. If you live in a country where land records can’t be found, or can be lost easily, then you could lose your house.
It’s the same with many other transactions: contracts can be faked; bank accounts can be hacked and the amounts modified.
So the key to keeping things safe is recording them in a safe place.
So, if you could take the information that you want to keep safe, create a way of encrypting it so that it can’t be changed, store that in a place where it can’t be deleted and be able to always prove which piece of information is right and which is wrong, then you would have a more secure system.
In essence, this is what Blockchain does. It creates an unbreakable code that is updated with careful rules that mean that information is much safer than before.
Some people think that this will change everything about the way in which we transact with each other, from money to contracts and more.
Others think that this is such a radical change which creates an entirely new way of recording what you own that it could take years to be accepted.
Over 2,000 years ago, people used clay tablets and sticks to record who owned what.
Blockchain pretty much helps do the same thing now.
Scientists say that the effect of climate change will be most seen in the polar regions. The ice will melt, sea levels will rise and temperatures will increase.
Water levels could rise by 40cm to 80cm, with a central estimate of 60cm by 2100, according to the IPCC.
A small rise in sea levels can have a big impact on coastal areas. Salt water can cause erosion, flooding, contaminate drinking water and soil and destroy habitats.
The ice also helps keep our planet cool. All that white ice reflects back 80% of the sun’s energy that falls on it.
It also takes 81 times as much energy to melt ice as it does to raise the temperature of the same amount of water by one degree.
So, once the ice is all gone, there is nothing stopping the sun from heating up the dark oceans.
All that extra heat, without the cooling ice, means drought in continental areas and a loss of food production, leading to famine in parts of the world least able to cope.
To return to pre-industrial temperatures, all that ice needs to freeze again, which means the heat in the water needs to be taken out first – adding to the heat in the atmosphere.
Warmer oceans occupying more volume mean that storms are going to be bigger and more powerful.
Hurricanes, cyclones and tsunamis will be harsher, more violent and reach further inland, washing away everything in their path.
Hundreds of millions of people will need to move, leaving their homes and moving inland and uphill.
Low lying islands will be submerged entirely.
So, the problem is that a small change in the polar climate – and the melting of the ice could have a devastating impact on the rest of the world, well beyond just the increase in sea levels.