How do we change from one product to another?

ladder-vs-stack-models.png

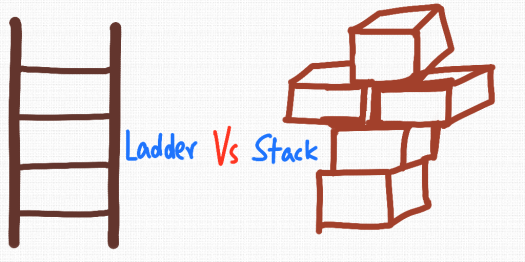
One way to think of change is like a ladder.

We move from rung to rung, stepping off the old one and committing to a new one.

For example, we used to burn firewood for cooking, and still do in some places. Then we moved to transition fuels, such as coal or kerosene. Then we might use cleaner fuels, such as electricity or natural gas.

This kind of transition seems straightforward, one way (upwards) and natural. You move from one choice to another and eventually stop doing the things at the bottom.

Another way to think of change, however, is like a stack.

In this model, you stack different choices on top of each other, perhaps continuing to use them all at different times.

You may try out two approaches at the same time, like two boxes stacked side by side, before moving on to try something else.

Continuing with the energy example, you may have gas-fired heating, but also install a wood-burner – going back to using firewood for heating.

Neither model is quantitative – but they provide different ways of looking at a situation.

Take software, for example. Let’s say you have a system that is a significant innovation on what is already there.

If you think of change like a ladder, then you need to persuade your market that they have to switch from what they are doing to your product in order to benefit.

If you think of change like a stack, then what you need to do is persuade your market that what you have builds on what they already have to create more benefits than they enjoy right now.

There is some evidence that the stacking model is a more accurate depiction of how people actually make choices than the ladder model.

The main difference is that the ladder assumes that people need to make a choice between one thing and another. This OR That.

The stack assumes that people want to hold on to what they already have and choose things that build on existing investments. This AND That.

Focusing on what people want will probably be more effective than telling them what they need.

The business of keeping things cold

cold.png

Keeping buildings cool in the United States takes as much electricity as used in Africa for everything.

We can easily miss the amount of effort that goes into keeping things cool.

We use cooling systems to air-condition our homes and commercial buildings, keep food fresh and transport it across countries and use it in countless industrial processes – from medicines to preservation.

The internet couldn’t survive without the vast amounts of cooling that go into keeping the data centres that power the internet economy going.

Increasing urbanization, with the majority of the world’s population living in cities, will make the challenges and problems associated with cooling worse, not better.

For example, the United States uses more energy for air-conditioning than the rest of the world put together.

Many developing countries, however, are getting richer fast and are in hot parts of the world. If they were to use air-conditioning like the U.S, they would use around 50 times more – and half the world’s energy could go just on cooling.

This could happen quickly. In 2010, Chinese consumers bought 50 million new domestic a/c units and 95% of Chinese homes have a fridge, compared to 7% in 1995.

If India had the same proportion of refrigerated trucks as the UK, the fleet would rise from the tens of thousands to 1.5 million vehicles.

The problem is that keeping things cold is a very polluting activity. The technology being used is a hundred years old, relies on chemical refrigerants and has plodded on – generally ignored in the background.

As we move into a low-carbon economy – increasing cold using conventional methods is not going to help us reduce emissions or stay on target.

That means there are a number of opportunities out there.

For example, we could learn how to use and re-use cold energy more effectively. With better data collection – using the Internet of Things (IoT) approach, we can figure out how to be smart in the way in which we cool things.

Keeping things cold needs energy – so using free energy from renewables, being smarter about when energy is used based on supply and demand and moving to ways of storing and moving cold energy rather than creating it on demand using electricity are all ways to be more efficient.

The challenge, as always, is to make a business case for action.

How renewable heating can be used for industrial processes

solar-energy-for-factories.png

Most people are aware of the potential for electricity generation from renewable sources such as wind and solar and how they can be integrated into buildings.

It seems natural to collect renewable energy, convert it into electricity, perhaps store that energy in batteries and then use the energy to do useful work.

But there are other areas to consider as well.

Most of our energy requirements, however, are in the form of heat, making up two-thirds to three-quarters of industrial energy demand.

Of this, around 57% needs temperatures of less than 400 degrees C and 30% is at temperatures of 100 degrees C or less. In addition, most facilities require space heating and hot water.

Using renewable heat directly, for example by installing advanced thermal solar systems, could provide up to half the heat demand in the industrial sector.

Simple off-the-shelf systems can provide low temperature heat at less than 80 degrees C while more complex solar concentrator systems can generate compressed steam at 400 degrees C.

Countries with high sun hours such as India, Mexico and parts of the Middle East are seen as key growth markets.

India, for example, has some of the world’s largest solar kitchens for community cooking, designed to feed tens of thousands of people at religious centres every day.

Over 80% of primary energy demand in industrial processes is currently met using fossil fuels.

A significant proportion of this could be displaced using renewable energy sources but there are problems.

Three quarters of the total heat demand is concentrated in a small number of energy intensive plants – around 30 -60,000 with existing industrial processes, temperature requirements and application areas. They would need to develop new expertise and compatible processes.

Costs for installing systems can be high up-front, even if the total lifecycle costs of operating are lower.

Despite this, there are an increasing number of installations worldwide and the Solar Heat for Industrial Processes (SHIP) database is a useful resource to get an idea of what is going on.

While such systems are unlikely to completely replace existing systems for creating heat in the near future, they will form an important component of hybrid systems that use renewable sources of energy primarily and call on fossil fuel based energy as a last resort.

When will we have have more zero energy buildings?

costa-coffee-eco-pod.png

In 2015 Whitbread, the parent company of Costa Coffee, announced that they had built the first zero energy coffee shop in the UK.

In an example of how constraints help create innovation, the building has a number of features that help it reach the ‘zero energy’ standard including:

  • A frame made from sustainable wood rather than steel
  • Solar panels
  • Capturing and using rainwater
  • Lots of insulation to keep heating and cooling needs low
  • Use of natural or passive ventilation
  • Underfloor heating

Two of the three things on that list, solar panels and rainwater harvesting systems can be added to existing buildings.

The others involve more work and disruption – insulation, changing heating systems and installing passive ventilation can’t be done without getting in the way for some time.

And changing the frame just isn’t an option for most buildings.

The amount of energy lost because a building structure is inefficient can be considerable.

These parts of a building also have a long life cycle and may only be replaced or upgraded in some cases after more than 60 years.

Organisations that look at the life-cycle cost of their buildings may find that the long-term benefits of investing in more energy efficient design now can create huge savings over time.

But they are also fighting the short-term needs of their organisations to conserve cash and limit budgets.

So, will things be better in the future?

It is easy to predict a future full of super-efficient buildings such as Costa Coffee’s, a de-carbonised transport system and zero-carbon development.

The problem is that there are many possible futures. Which one is most likely?

A good way to predict the future is to ask what you have done so far.

In other words, instead of asking “What are you going to do to become more energy-efficient”, you ask, “What have you done so far to become more energy-efficient”.

For the vast majority of people and organisations, the answer is going to be “not much”.

And for a futurist, that suggests that in the future, people will still not do very much.

A key reason for this is that the costs of investing in projects like Costa Coffee’s needs resources now and the benefits come later.

As human beings, we are built to overvalue the present and discount the future, and this naturally leads to inaction and apathy when it comes to looking at such projects.

This is why regulation and government action in this space is so important to spur innovation and creativity.

So, while in many areas we need the government to get out of way of business, building standards is one where we may need more intervention and not less to create a low energy future.

How to create energy from underwater kites

underwater-kites.png

In 2015, a £25m project was launched to install underwater “kite-turbines” in Holyhead Deep, off the coast of North Wales.

Swedish developer Minesto has built the turbines and plans to commission the project in stages, starting in 2017 with a 0.5 MW demonstration unit of their patented Deep Green ocean energy power plant.

Unlike airborne kites, which turn a generator on the ground, these underwater kite-turbines have a wing with a turbine attached directly to it.

The underwater current lifts the wing and the kite is steered in a figure-of-eight at several times the speed of the current.

The water flows over the turbine blades and turns them, producing electricity, which is then transmitted through to a cable to the kite-turbine’s tether on the seabed and from there to the grid onshore.

Most existing tidal technology is large, fixed and can operate only in currents that are faster than 2.5 meters per second.

Because the movement of Deep Green increases the speed at which currents flow over the turbine, it can operate at lower speeds than fixed installations, down to 1.2 meters per second.

Each turbine is rated at between 150 and 800 kW and can work submerged in depths of 15 meters to 300 meters.

Kite-turbines can also be up to 15 times lighter than fixed alternatives, at around 10 tonnes.

The locations for these generators have to be chosen so that they don’t interfere with shipping or other sea users.

Following the demonstrator project in 2017, the site will be gradually expanded to house 20 power plants producing 10 MW.

Minesto have also announced that they are looking to take the eventual size of the array to 80 MW.

The cost of energy from this technology could be around £1 million per installed MW at this point, although costs could decrease with scale.

The UK is in a unique position to harvest energy from tidal resource – it has around half the European tidal resource and 10-15% of global resource according to Minesto.

Tides are also very predictable, making this kind of technology very attractive if it can be deployed at scale because it uses renewable resource and its output can be predicted with a high degree of accuracy.

What the prices of batteries mean for storage applications

Battery-price-chart2.png

The prices of battery packs fell from close to $1,000 per kWh at the start of the decade to $227 in 2016, a drop of around 80% according to a McKinsey study released at the start of the year.

Current projections put them on course to fall below $200 per kWh by 2020 and below $100 per kWh by 2030.

What impact does the cost of batteries have on the overall business case for producing an electric vehicle?

Some interesting numbers are discussed in this Tesla forum article:

  • There are claims that Tesla’s internal cost of batteries ranges from $150 to $240 per kWh now.
  • GM revealed that their battery cost at cell level was around $145 per kWh.
  • A 60 kWh battery pack would make up $10,440 of the $37,495 Chevrolet Bolt at a pack price of $174.

This means that the cost of batteries for an electric vehicle drops to under a third of the price of a car and could drop to under a fifth by 2030.

Lithium-ion technologies dominate the battery storage market, making up 95% of new energy storage projects according to McKinsey research.

The same research found that battery storage applications are already economic in four important areas – demand charge management, grid scale power, small-scale renewables and storage and frequency response.

They also note that in applications such as demand charge management and small-scale renewables, lead-acid batteries may work better than lithium-ion.

It is likely that in the coming years packages of energy storage solutions for industrial and domestic use will become simpler and easier to buy and install.

Falling prices as the technology improves in any industry benefits consumers more than the producers – buyers will gain most of the benefit from price reductions in battery technology.

Energy storage has the potential to tranform the energy system as we know it, and it looks like it could happen faster than anyone expected.

When should you use algorithms for decision making?

low-high-validity-environments.png

Many of us use algorithms every day for decision making.

We don’t always trust them, however, and tend to use them less if they have shown themselves to be imperfect in the past.

We tend to judge algorithms by how well they do at meeting a performance goal of some kind, rather than working out whether they will do better than the method we currently use.

This usually results in worse outcomes.

For example, if you drive, the chances are that you use a satellite navigation system often.

Whether it is a standalone system with built in maps or a connected system with traffic feedback like Google maps, how often have you decided to ignore the guidance and decided you know best?

The chances are that you will do better more often by following the guidance.

Algorithms work better in some situations than others.

Broadly, there are three kinds of situations or environments you could face.

In the image above these are categorised into learnable situations, where you can improve through practice, and the predictability of situations – whether you know what could happen next or not.

A zero validity situation is one where you can’t learn through practice and you don’t know what could happen next. A career path for a baby, for example, or the direction of world policy with Trump and Brexit.

A high validity situation is one where you can get better with practice and you can tell what is going to happen next.

Learning to play tennis for example, or learning to drive a car.

You know that a ball is going to arrive in your direction in the near future, or that you will need to drive in a straight line, or around a curve or slow down or speed up.

Between these two extremes is a wide range of low validity situations characterised by uncertainty and unpredictability.

The nobel prize winning economist Daniel Kahneman writes about how algorithms perform best in such low-validity environments.

These cover a wide range of situations including medicine, recruitment, finance, logistics and so on.

In study after study we find that simple rules outperform experts.

For example, a simple six point model outperformed doctors in judging the probability of cancers in a patient.

A stock market index fund that that simply follows the top 500 companies will outperform the vast majority of expert stock pickers.

Using a few measures to score applicants will select candidates who will perform better than those selected by “gut instinct”.

In fact, selecting applicants purely based on the information in CVs can produce a better result than selecting after an interview.

Algorithms don’t have to be complex. They can be based on simple rules based on existing statistics or common sense.

What algorithms do is help cut through the “noise” and focus on a few factors that can make a difference.

When used well, algorithms can help experts make much better decisions by helping them bypass their own cognitive biases.

We should all be using them much more in our work and lives.

The 1 kWh Energy Reduction Strategy

accumulation-of-marginal-gains.png

The business case for energy efficiency should be simple: the cheapest unit of energy is the one you do not use.

In spite of this, why is hard to get energy efficiency and energy reduction projects underway?

According to the International Energy Agency (IEA), energy efficiency is the only energy resource possessed by all countries.

Globally, we are making progress on energy intensity – it’s just that we aren’t making enough progress as fast as we need to do.

According to the IEA:

  • Global energy intensity improved by 1.8% in 2015 (2014 = 1.5%).
  • Emerging and developing countries reduced intensity by 2.5%, doing better than developed countries who managed 2%.
  • China is the best performer, with a reduction of 5.6%.

Although this is good, we need to have an annual improvement in energy intensity of 2.6% globally to meet our climate goals.

A 2.6% improvement doesn’t seem challenging. At an individual and organisational level, why is it that we can’t easily meet that target?

The problem is that globally is that more than 70% of energy usage is not covered by any form of energy efficiency performance requirement.

Two-thirds of buildings built do not have to comply with codes or standards.

In these situations, market forces determine what gets done, and people will quite often go for the cheapest option, which may not always be the most efficient.

For example, India is the third largest energy user in the world and installs a staggering amount of solar panels.

As it gets richer, however, it is also installing more air-conditioning, and so its energy demand is rising faster than the amount of new clean generation being installed.

Large projects face large challenges

Governments and policy makers want to meet climate change targets in the quickest and easiest way possible.

That is why they focus on large projects, such as the Hinkley C nuclear plant. The idea is that it will deliver both a substantial amount of secure energy and have a lower carbon impact, helping the UK government meet its targets faster.

The public debate and scrutiny, however, can be intense. It takes a long time to get such projects approved and underway.

In organisations, large energy efficiency projects that involve high capital costs, longer payback times than core business options, or the need to enter into long term agreements with third parties can face several hurdles.

You need to put together business cases, have them reviewed by panels, go through approvals processes before they are eventually accepted or denied.

Governments know this, and that is why much policy focuses on creating new infrastructure.

It is easier to get people to do something new from scratch than it is to have them fix an existing situation.

The solution may lie in a concept called ‘the aggregation of marginal gains’

Doing small things better regularly adds up over time.

This method can be traced back to the Austrian chess player Wilhelm Steinitz, who applied an ‘accumulation of small advantages’ to gain a positional advantage in his play and became the first official world chess champion in 1886.

The most current example of this approach is how Sir Dave Brailsford transformed British Cycling and the performance of Team GB in the Olympics.

His basic idea was that if you broke down all the activities involved in winning cycling races into their component parts and then made a 1% improvement in each of those components, then the gains would add up to a significant amount.

Another example is Mazda’s 1 gram strategy.

What they do is look for ways to save just 1 gram in weight from each component of the car.

The Mazda2 weighs a little over a tonne and this low weight means that Mazda can use less expensive transmission technology, making the car more affordable, more efficient and requiring less materials to build.

At the same time, the lighter car makes for a agile and nimble ride – keeping Mazda’s ‘zoom-zoom’.

Is a 1 kWh strategy the answer?

Instead of focusing mainly on large projects, perhaps applying a 1 kWh strategy is the way to get significant energy reductions in organisations.

In Europe, with two years to go before mandatory energy audit reports for large organisations have to be done for the second time, energy managers should look at the small changes they can make every day.

Look at every component of how your organisation uses energy, and see if you can shave just 1% off that.

There are 200 working days in a year. If you asked each person to work from home just 1% of that time – 2 days a year – what impact would that have on the fuel consumption associated with commuting?

If you have 5,000 lights that are on all the time, what would removing 1% of them, or 50 lamps, do to your operations?

What would a 0.5 degree change in your setpoint for heating or cooling do to your building’s need for electricity?

How would removing one printer in a hundred affect the way in which your business worked?

How would replacing one desktop in every hundred with a laptop impact your staff?

We ignore small wins too often because they don’t seem worth the effort.

The point, however, is that the “long tail” of small wins could get you to where you need to be in terms of energy efficiency without stumbling at all the hurdles that are associated with large projects.

The ‘aggregation of marginal gains’ strategy has worked in fields as diverse as sport, automotive manufacturing and healthcare.

There is no reason why it shouldn’t work across industry and business in general.

Why you might want to walk to work an hour earlier or later

cars-idling-and-person-walking-colour.png

If you walk a kilometre to work in a city along a road used by commuters, you could quite easily pass 200 cars queuing and moving slowly along.

Car engines produce exhaust emissions that contain nitrogen dioxide, carbon monoxide and particulate matter.

Particulate matter, or black carbon, is associated with cardiovascular diseases and respiratory problems, such as asthma.

Air quality is becoming an important issue in many parts of the world.

The UK government was forced to release its plan to reduce nitrogen dioxide in towns and cities after a ruling by the high court.

The court considered the threat to public health “exceptional circumstances”, with nitrogen dioxide pollution is linked to 23,500 deaths a year in the UK.

The draft plan focuses on introducing more efficient vehicle technology and moving to electric vehicles as key steps to reduce air pollution.

Diesel vehicles are the biggest contributor to the problem, with nitrogen dioxide emissions from them at nearly 10 times the emissions limits set out in Euro standards.

If you walk or cycle along a busy route, you could be exposed to 40% more black carbon than along a quiet route.

This is hard to measure, however, as some measurements have not found a statistically significant difference between peak and off-peak hours.

The study still found that you could reduce expose to particles by walking a less polluted route.

You could also do this by avoiding peak hours when there are lots of commuters heading to work.

The issue is important enough for Defra to have a daily pollution forecast. Parents and schools are also running campaigns to get drivers to stop idling when stationery.

A final air quality plan is expected to be released by the end of the month.

Change is going take time, however, with the provisions being phased in by 2050.

If you have the ability to work flexibly, perhaps now is the time to start thinking about avoiding peak times when making your way to work.

Why do fuel prices go up fast and down slow?

Gas-stations-opposite-each-other.jpg

Households in the UK spend between 12 and 27% of their disposable income on transport, of which a third can go on the cost of fuel.

People spent, on average, £72.70 on transport in 2016 and the cost of petrol and diesel was the biggest contributing factor.

Oil prices went up and down in 2016. At the start of the year, they were low and went lower on abundant supplies, with the spot price of crude oil heading towards $25 a barrel.

In the second and third quarter of 2016, producers responded with spending and production cuts, which helped prices head back towards $50 a barrel.

By the end of the year, OPEC’s decision to curb production and stick to quotas and an agreement from other countries to reduce output sent prices towards $55 a barrel.

So, in a market where global prices can double or halve in a year, why do these increases or decreases not show up in prices at the pump?

A litre of unleaded petrol in the UK went from around 102 pence per litre to 115 pence per litre by the end of the year.

We’ve all seen that when global oil prices fall, the reductions don’t seem to show at the pump. But when they rise, the price at the pump seems to go up straight away.

Why is this?

It’s not just imagination. It turns out there is a phenomenon, described in the industry as “Rockets and Feathers” that takes place.

In a commodity market, where prices are posted daily for all to see, as in the domestic fuel market, retailers know what each other is charging.

If oil prices go up, one retailer can raise prices in the knowledge that others in the area will see the increase, and feel like they can increase their price as well to benefit from the increased margin.

As everyone can see the posted price, this can even act as a signal to other producers – although there is no actual collusion taking place.

On the other hand, when global prices fall, each retailer can wait for someone else to take the first step.

Again, because they can see all the prices, there is no need to drop their price until someone else does first.

So there are different incentives when prices go up compared to when they go down.

This is why price go up fast, as one retailer raises its prices, the others notice and they raise theirs as well. On the way down, everyone waits for someone else to make the first price reduction.

And so, prices rocket up and drift slowly down.