How has the party been for you over the last 30 years?

ftse-1995-2017.png

If you entered the world of work after 2008, your experience is probably one of sustained growth where things have only gotten better.

Since the financial crisis, which resulted in markets falling to a low in 2009, the world has seemed to be on a path to recovery. Stock markets have risen, houses prices have remained stable and many people are employed.

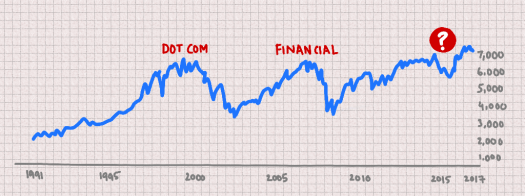
The FTSE, shown in the chart above, has risen from under 4,000 in 2009 to over 7,000 today, an increase of 75%.

But, as Santayana said, those who cannot remember the past are condemned to repeat it.

We live in a world where valuation and value are not the same thing.

The dot com crisis at the start of the millenium resulted from ascribing absurd valuations to companies that were little more than dreams and wishes.

The financial crisis in 2008 happened when complex contracts designed to spread risk turned toxic and concentrated it instead, corroding trust – the grease of modern economies – and bringing the whole financial system to a grinding halt.

And now we come to 2017.

Is the steady rise we have seen over the last seven years because of a real recovery or because of something else?

The internet has grown up after all – it’s now transforming how we live our lives and do things. So perhaps the new digital connected economy is helping economies change and grow?

An alternative explanation is that governments have pumped vast sums of money into the system to keep things working.

This money is injected through financial institutions and has to go somewhere – it has to be “invested”. So the money goes and accumulates in certain places – companies, commodities, bonds that promise returns.

The issue is that there is more money chasing these assets that have returns, and so people are willing to pay more for them, and as a result their valuation increases.

Since BREXIT, the UK index has risen because a weaker pound makes the largest businesses in the UK more competitive globally, increasing expectations that their profits will rise and pushing up their valuations.

Conversely, when the exchange rate drops, the valuation of these businesses falls as well – the FTSE 100 is inversely correlated with interest rates.

So, what should you do now? Should you sell everything and walk away from markets? Should you double down and buy some more?

As Blaise Pascal said (almost), all of humanity’s problems stem a person’s inability to sit quietly in a room alone.

The markets will go up and down. Given where they are, it makes sense to be prepared both psychologically and financially in case they fall once again.

The thing to remember is that percentage changes are not symmetric. A 75% rise only needs a 43% fall to wipe out all your gains.

At this point, it might make sense to invest with a mindset that is prepared to have your investment take over 10 years before it shows a profit.

How do we really make investment decisions?

decisions.png

If you were rational, this is how you might make a decision:

  1. Set out the alternatives – what are the choice you have?
  2. For each choice, what is the payoff – what are you likely to get?
  3. Again, for each choice, what is the probability that it will happen?
  4. What is the expected value of the option (probability x payoff)

With choices that lead to other possible choices, you need a decision tree and the ability to work out sequences of expected value.

You then choose the approach that results in the highest expected value.

This approach, however, is not intuitive, and most people are not wired to approach decision making in this way.

In addition, it’s a little old. The statistical basis for this approach lies in the work of Thomas Bayes in the mid-1700s. Our knowledge of people has moved on a bit since then.

There are two situations people face often when making personal and business decisions.

The first situation is when they know the chances of winning or losing.

For example, lets say you entered a game where you could win £10 or lose £5 on a coin toss. There is a 50% chance of either, and you might be tempted to take a punt at this level.

Most people would not take the bet if the option was between getting £1,000 or losing £500. The fear of losing would overwhelm the prospect of winning.

The other situation is when they don’t know what might happen and the risks that could emerge.

Quite often, the next thing to go wrong is completely different from the ways in which things went wrong before – and all the planning and controls that were in place to avoid the last disaster fail to prevent the next one.

A more human approach to making these decisions is based on Plausibility Theory and in particular the idea that you may take a risk as long as your downside is capped.

In other words, you may be willing to take a decision that you expect to be profitable, as long as the loss if you are wrong is limited to a certain level.

This approach became popular around 15 years ago as the concept of Value-at-Risk (VaR). Using this approach, you put in place a management system that ensures that you limit your loss to a particular level, say 1 or 2% of your portfolio value, and then work to get the most profit out of the opportunity.

So… you avoid the ugly end result, limit the worst case to a bad result and work on achieving a good result.

But… mathematicians ruin everything.

VaR was quickly adopted in many financial models – from standard portfolio markets to energy, and complex models were used to justify the products that were being introduced. They even formed part of the Basel II rules used to regulate international banking.

Which then failed rather spectacularly to prevent the global financial crisis that kicked off in 2008.

Although arguably that was down to smart people who figured that they could use the methods to try and take greater risks with other people’s money while at the same time reducing their own personal risk to almost nothing.

After all, how many executives of banks have been tried and convicted for their role in the crisis?

So it looks like the people managing your money applied Plausibility Theory rather well, except they did it to benefit themselves rather than you.

The takeaway is perhaps that the next time you make an investment decision, figure out what will happen to you if things go horribly wrong before being enticed by the promises of future returns.

It’s not personal, it’s just programming

robot-doing-interview.png

We could be hearing this title line from the film Tomorrowland a lot more in the future.

Much of what we do is increasingly determined by robots.

It used to be determined by people in power.

The phrase “Nothing personal, it’s just business” is familiar to most people, and was apparently coined by organized crime, a group that rely on the application of power. The saying even made its way into the film Godfather.

So where do we see this happening?

The most visible application is in the recruitment business.

Everyone who has applied for a job and had to go through a screening process has experienced this.

From a recruiter’s perspective, sifting through a pile of applications can be the most time consuming activity in the recruitment process.

Surely it makes sense and is fair to get applicants to log into a portal, complete a set of questions that measure their match for the role and interview only the ones that score the best?

But hiring technology company HireVue takes this a few steps further. Their homepage looks like something out of the series Lie to Me, where an expert studies facial expressions to get to the truth.

The company provides the techology to carry out unmanned video interviews where candidates record their responses to questions and the software analyses their emotions and facial expressions, speech patterns and language patterns, integrating all that information to presumably provide recruiters with more insight into candidates.

It sounds like something the CIA would find useful.

Then there is the news, something which dominates our perception of what is happening in the world.

Is the information we are getting the “real” thing or are we being fed a diet of processed news by robots?

The Associated Press began using robots in 2015 to generate automated news stories based on fairly standard styles and outlines.

The idea was that the day-to-day standard news reports can be automated and free up humans for complex, nuanced stories.

In the UK, Google is funding a project where robots will write local news. They will take data feeds and create local versions so that you will be able get news customised to your location and criteria.

This activity also carries dangers. When it is quick and easy to take and rework and republish stories, the chances are that fake news can spread just as quickly as real news.

The checks provided by experienced, sceptical journalists that look to verify assertions may be lost in the process, resulting in an avalanche of incorrect information that can be impossible to reverse.

There is no doubt that the robots are here to stay, and as we use them more we will learn better how to use artificial intelligence, machine learning and algorithms to make better decisions about everything from which route to take to whom to marry.

If you’re on the wrong side of the table, however, life could get more bewildering.

Do we know what we should be doing for BREXIT?

sticks-carrots-and-tambourines.png

Steven Landsburg in his book The Armchair Economist says – Most of economics can be summarized in four words: “People respond to incentives.” The rest is commentary.

What exactly are we, as individuals and businesses, supposed to do to prepare for BREXIT?

The Department for Exiting the European Union has 41 publications, none of which seem to be particularly useful.

The first paper produced by the department is on “aspirations” for future customs arrangements. It notes that 200,000 businesses trade with the EU and imports and exports to and from the EU are over half a trillion pounds.

Is that big or small?

There are around 2 million businesses in the UK, 97% of them very small. Around 10% will be affected directly by the changes to trading, which would appear to be significant.

90% of future economic growth is going to come from outside Europe, a third of that from China.

The UK, however, cannot agree trade deals with any other countries until after it leaves the EU in 2019.

This may not be a problem. Most of the world seems happy to trade under World Trade Organization (WTO) rules.

Ruth Lea of the Arbuthnot Banking Group argues that trade with non-EU countries such as the US, China, India, Australia, Canada, Russia, the Middle East and so on have grown significantly in the absence of trade agreements.

In her words, “commercial factors and growing markets are arguably of far greater significance than trade agreements.”

There is quite a lot happening that businesses looking to grow should be aware of.

For example, the UK India Business Council highlights sectors that are changing rapidly from Advanced Engineering and Manufacturing to Sports Sciences.

There are opportunities here, but they require engagement and effort to get going.

It may be up to individuals and businesses to chart their own course through the changes that BREXIT will bring.

A global mindset and willingness to develop the capability to collaborate and work with partners around the world may be the differentiating factors that sort the winners from the losers as the system changes around them.

We need sticks, carrots and tambourines to get this right.

The government’s job should be to create the right incentives (sticks and carrots) to encourage the actions that will result in sustained growth.

Equally importantly, it needs to get better at strong and sustained communication (tambourines) about the benefits of international trade for all businesses.

Is it time yet for another crisis?

elephants-in-rowing-boat.png

We had the dot com bubble at the start of the millenium and the financial crisis in 2008.

Where is the next bubble building and when could it pop?

Markets are now highly correlated – information is plentiful and most people know most of the same things about what is going on, and so make pretty much the same decisions about what, when and how much to buy.

Whether it’s shares, bonds or commodities, the large players all have more or less the same approaches and strategies.

And that leads to a problem.

If everyone were suitably diversified, and held enough different things, then no one thing should be enough to cause a crash.

But this isn’t how it seems to work in practice.

The financial crisis showed that all the major financial players were exposed to the same kinds of toxic products that they didn’t understand.

Like elephants in a rowing boat, when they all tried to get to the other side to escape, the whole thing tipped over and was in danger of sinking.

Governments had to step in and bail them out.

Apparently its easier to let markets blow bubbles and pick up the pieces when everything falls apart than it is to try and stop them before they get out of control, according to Alan Greenspan, once the U.S Federal Reserve Board Chair.

Since bottoming out after the financial crisis in 2008, stock markets recovered steadily and hit new highs.

Many investors, wary of overvaluated stock markets, began piling into bond markets.

That has led to higher bond prices and lower yields. Many bond yields are in fact negative in real terms.

The actual yield, however, is not always the main criterion. Having bonds in your portfolio acts as a hedge against the stock component.

If you could have had a 100% stock portfolio and it would have fallen by 50%, you might feel relatively happy if you actually had half your portfolio in bonds, and the actual drop was 25%.

Bonds have traditionally been your friend when things go wrong.

It’s not at all clear whether high valuations are a threat to markets.

Some people say that if interest rates rise, then all bets are off, markets will crash and values will fall.

Others say that just having valuations move higher is not the problem – the risk comes from increased lending for dodgy purposes.

Or in a slightly more technical words from Jim Chanos, a prominent short seller, “Bubbles are best identified by credit excesses, not valuation excesses.”

The existence of new and risky lending practices, however, is often hard to pinpoint until after they have wreaked havoc on the system.

Until then they are likely to be hailed as the best thing since sliced bread.

The rule of thumb is that a crisis happens every decade and a depression every seventy or so years.

Ten years after the last crisis, we might do well to be wary.

Should knowledge be accessible to everyone?

closed-door-or-open-door.png

Publically funded research in Europe could be free to access by 2020 if the European Union carry out necessary reforms.

At the moment, despite there being more information available than ever before, access to high quality research is still limited to people who can either pay for it or belong to universities that can afford the subscriptions.

This freezes out the vast majority of people from accessing scientific knowledge.

The Open Science movement is an attempt to change this, making the results of research and the underlying data more accessible to all levels of society.

The main arguments against open science are:

  1. The peer-review system operated by journals maintains quality.
  2. Scientists should be compensated for their work
  3. Widely available data could be misinterpreted by lay people.
  4. Making certain kinds of research findings public could mean they are misused, for example to create biological weapons.

The proponents of open science argue that:

  1. Publically funded research should be available to the public.
  2. Open access means that there will be more review by a more distributed readership.
  3. Open science will make findings more reproducible.
  4. More people can apply the findings

For individuals and businesses, the easiest thing to do right now is rely on the first few results of a google search to provide all the evidence they need to make a decision.

This results in inevitably narrowing the amount of information that is taken into account when analysing a situation and deciding what to do.

One of the benefits of a well written paper is that the author takes the effort to examine prior lines of thinking, point to seminal works in the field and set out why the information in the paper is new and relevant to you.

This contextual approach is crucial – relying on easily accessible information can create a bias and it is important to consider alternatives to the options that seem most obvious to make good decisions.

There appears to be little truly useful scientific information out there to help businesses improve how they operate, especially ones that operate in niche manufacturing fields.

Perhaps making scientific research more open and accessible is one way to change that and make organisations more productive and sustainable.

Some open science resources are:

How to use data to understand and predict the future

big-data-vs-thick-data.png

The world’s largest corporations are increasingly investing in projects to try and use data for better decision making in their businesses, to improve how they work from marketing to operations.

Why is it then that nearly three-quarters of big data projects are unprofitable?

One explanation is put forward by Tricia Wang in this TED talk.

We use data to help us understand how the world around us works, and we hope that this understanding will help us predict what is going to happen in the future.

But, depending on how we approach the idea of data, this results in different tactics by different organisations.

The “hot” approach is the one of big data.

Everything is connected – the internet of things (IOT).

Data is collected automatically, recording everything from your browsing history to when your toaster turns on and off.

Tricia Wang has invented the term “thick data” for an approach to collecting data by observation – something done by the likes of ethnographers and anthropologists.

This is a modification of the term “thick description” that tries to explain behaviour and the context in which the behaviour takes place.

So, in big data, computers collect information from customer “touchpoints” – the places where you interact with the machines.

In thick data, people collect information by observing and interacting with other people.

Tricia’s example of how this results in different outcomes is the case study of Nokia.

The huge amount of data collected by Nokia from its customers and market research failed to alert them to the possibilities of the smartphone.

Tricia’s research showing that low-income Chinese people were willing to spend half their monthly income on buying a phone convinced her that the smartphone would take off.

And we all know what happened to Nokia when the iPhone took over the world.

In a big data world more is better – sample sizes are huge.

We collect millions of data points and store these in the cloud.

Tools like IBM’s Watson help you analyse and evaluate this data for not just quantitative insights but also, through natural language processing, for emotional components and behavioural predictions.

With thick data, we have a small number of data points.

Someone has to spend time with people, observing what they do, where they do it and draw conclusions on what that means for the future.

Big data helps you quantify the world.

All the measurements you take give you the ability to look at how people interact with your business in a level of detail beyond anything that was possible before and express this in numerical terms.

Thick data helps you explain why people do what they do.

Taking time to watch and interact with people gives you insights into the way they think and behave and, crucially, what they might do next.

The point is that it is not an either-or situation.

Using just big data is not enough.

Combining the power of big data to quantify and the power of thick data to explain can give you a better understanding of the situation.

Take a simple example of thick data in action.

If you have watched The Social Network, you’ll remember a scene where Zuckerberg is trying to figure out what to do with his system.

Over a drink, his friend comments that it would be great if people had a badge that said there whether someone was single or attached.

Zuckerberg has a flash of insight and adding that feature to facebook causes subscriptions to rocket.

In other words – if you work out how use both big data and thick data in your business, you are more likely to be able to better understand and predict the future.

Why change efforts fail

problem-solution-conflict.png

Organisations are constantly implementing new initiatives to improve the way in which they do things.

Why is it that so many of these efforts fail?

Robert Fritz describes an interesting way of analysing and showing these situations in his book Corporate tides.

He argues that the existing structure of an organisation undermines and frustrates efforts to change things.

Take, for example, a common problem in many organisations – a strained workload on people.

The solution to this problem is to add more people to help with the workload. So quite often managers will start recruiting.

Another problem is the need to maintain earnings and manage budgets.

Adding more people has an impact on budgets, and the solution to that problem is to limit hiring new people.

Limiting the number of people hired then has an impact on existing staff and their workloads.

The image above shows this, adapted from the method used by Fritz.

We have problems and associated solutions.

What is not immediately obvious to the people involved is that the solution to one problem can often make another problem worse.

This is because different managers are involved and don’t necessarily see the way everything interacts.

In large organisations, these dynamics can take years to play out.

A period of hiring by operational managers can lead to a clampdown in the following years by financial managers – leading to a constant oscillation between one bad situation and another.

We see this tension again and again in corporate situations. For example:

  • Between long-term investment and the need to report short-term results.
  • Between decentralised decision making and central control over the organisation.
  • Between employee responsibility and managerial control

This is why change efforts based entirely on dynamic energy and good intentions can make a difference for a while, but fail in the long run.

For example, you could bring in a manager that through sheer energy and momentum creates a new way of doing things.

As soon as that driving force is removed, the organisation resumes its normal pattern of doing things – its state of equilibrium.

What is “normal” is determined by the structure that is in place.

The structure might not be immediately obvious or visible, but it has a huge impact on whether change will succeed or fail.

The implication is that if you want real change, you can’t just fiddle with an inadequate existing structure.

You first need to establish a more suitable one – and that should be the primary focus of managers in strategic leadership positions.

The four principles for investment success

four-principles-for-investment-success.png

It sometimes seems that the process for investing money is made much harder than it should be.

Whether you are investing on behalf of yourself, putting your savings aside every month, or making decisions on behalf of a large corporate, there are four princples for investment that are worth keeping in mind.

These principles are set out in the investment philosophy followed by Vanguard, one of the world’s largest investment companies.

Vanguard was founded by John Bogle who created low cost funds designed to make investing simple.

Fans of Bogle are called Bogleheads and supporters include Warren Buffet who wrote that Bogle is the person who has done the most for investors by urging them to invest in ultra-low-cost index funds.

The four principles, however, apply beyond just personal investing and to a range of decisions we face.

1. Set clear goals

You need different approaches for short-term and long-term needs.

The same investment plan cannot be used to save for a house deposit, school fees or for retirement – you need a different approach for each one.

For short-term needs, you may better off with ways of saving money that are safer.

For long-term needs you may be happier with more fluctuation if you don’t need the money for a while, but much less comfortable with volatility if you are close to retirement.

2. Diversify asset allocation

You don’t know what is going to do better at any given period.

Quite often, something that does poorly one year can be the best performer next year.

Trying to pick winners usually results in you losing your stake.

The option that appears to work best is to keep a wide selection and pick from the entire market. The more you have in your collection, the less impact any one pick has on your results.

3. Minimise cost

Investors can’t control markets.

What they can do is control the costs of investing.

Every pound paid in fees or commissions reduces the returns to the investor.

Most managed funds do worse than an unmanaged index fund that tracks the market.

Worse, some managed funds are simply “closet” indexers, where they take large fees but simply follow the market.

Pick low-cost options wherever possible.

4. Be disciplined and think long-term.

Investing is a marathon, not a sprint.

The power of long-term investing lies in the ability of investments to compound over time.

With a long enough time-horizon small, regular investments can add up to a large return.

The mistake some people make is to react emotionally to short-term volatility and make quick, rash decisions.

Being discipled and following a long-term strategy is the best way to counter emotional responses.

Set your strategy, make your decisions and then get on with other, more important things.

How to choose your next job

decision-table-job-parameters.png

How do you make a decision about what to do next?

Which job should you choose, which option should you explore, which project should you spend time on?

These are problems we face every day, often under time pressure and with limited information.

Take, for example, one of the most important decisions you make – what job to do.

This is a decision that has a major impact on your life and carries a lot of emotional weight. You will be influenced by experiences in previous jobs and what your goals and expectations are of the future.

It is a high stakes, high emotion decision.

In a crucial decision such as this, you should be taking into account several parameters and thinking clearly and carefully about your options and what you should do.

Instead, the human brain often gets overwhelmed and focuses on one or two factors and excludes other, equally important ones.

It defaults to emotional decision making, with people making choices about how they feel about the factors that seem most important at the time.

One study, for example, found that more than half of the people surveyed left their job because of their relationship with their manager.

That single factor might have been enough to discount all the other positive factors that might have made it a better choice to continue with that job.

So how do we make better decisions when it comes to a crucial problem like choosing your next job?

One tool that can help is called a decision table.

First, identify the paramters that are important about the problem.

What are the things that you should consider when assessing the choices you have open to you?

When you are doing this, it is important to consider more than just the ones that come readily to mind. What do other people think, what does the research indicate?

The list of parameters in the image above are from research that was carried out that identified the eight factors that were most important to the study participants when it came to job satisfaction.

Second, assess each job option you have against the parameters.

The question to ask yourself is, “Will this job mean I am better off or worse off on this parameter”.

A simple coding system to use is to use 0 when there is no change, + when you are better off and when you are worse off.

In addition, you could use ++ and to indicate when an option makes you much better off or much worse off.

Just doing this exercise means that you will consider each factor in turn and assess how your life will improve or worsen under each option.

At the end of the process, you will have a table that shows you how each job compares on the parameters or measures that are important.

Now that you have considered all the parameters, you can figure out which ones are more important to you.

Are you, for example, prepared to take on a long commute for the prospect of much more pay?

Or would you rather have less pay and a better commute?

Are you ambitious – is getting a promotion really important? Or are you at a stage when you want a job that will pay for food while you get on with something that is important to you, like a creative pursuit?

A completed decision table will help you have that discussion with yourself or with someone else and help you consider all the factors that are important. It will lead to a more balanced decision.

It also greatly increases the chances that the decision you eventually make will actually result in better job satisfaction.

The same process can be applied to other areas. Perhaps not things like whether you should have coffee or tea, but definitely the important decisions, like where to invest, what to do, who to enter into business with.

When you have a problem that is important and where there is a high emotional component, that is the time to get out a pencil and start working on a decision table.