How to make your way to higher profits

power-curve-of-economic-profit.png

Most of us are stuck in a zone where we make hardly any money.

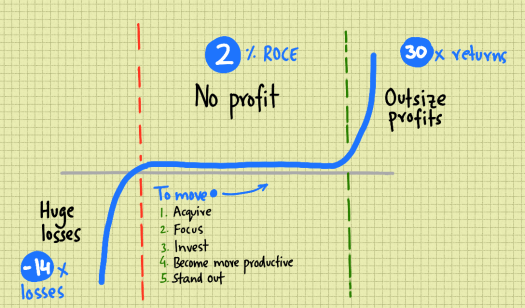
It turns out that the profits made by organisations fall along a power curve.

This means that most fall into a zone where their returns on capital employed are tiny.

They make net returns of less than 2% on invested capital, making 10% gross and paying out 8% to lenders.

Chris Bradley, Martin Hirt and Sven Smit from McKinsey explain how in this article, showing that companies at the top make around 30 times as much as the ones in the middle.

The ones at the bottom make losses of over 14 times.

This works out to around $50m in the middle, nearly $1,500m at the top and losses of just under $700m at the bottom.

They found that around half of where we sit on the curve depends on the industry we’re in – Tobacco is at the top, paper is languishing in the middle.

As the saying goes – before you climb the ladder, make sure it’s leaning against the right wall.

It’s better to be average in a great industry than great in a poor one.

This has echoes of Warren Buffett who wrote when a management with a reputation for brilliance tackles a business with a reputation for bad economics, it is the reputation of the business that remains intact.

As this McKinsey article shows, returns are highest in pharmaceuticals, household personal goods and software, and lowest in utilities, telecommunications and transport.

So what’s the answer?

It turns out that to move up the curve, we need to do the basics plus a bit.

The authors come up with five points.

The first is to have a disciplined acquisition process. We need to evaluate and buy businesses that are a good fit for us.

The other four are basic good business practice.

We should focus on the areas that are doing best, moving more resources to them.

We need to invest in our capability, putting capital into the business so that we have the technology and resources to respond to the market.

Becoming more productive goes without saying – doing more with less.

We need to stand out – differentiate ourselves by innovating and creating new business models.

Interestingly, this power curve could be used to describe individuals and their careers just as much as organisations.

A few make a lot of money, the vast majority get by and some lose a lot.

The question that we need to answer is what moves we’re going to make next.

The authors argue that these need to be big ones – just doing what everyone else is doing isn’t enough.

We need to do more and go further if we want to break out of where we are and move towards a more profitable position.

Doing nothing is a bad idea.

When should you get really interested in new technology?

technology-readiness-levels.png

The pace at which technology is developing appears to be speeding up all around us – so what should we do in such an environment?

Technology developers and evangelists can have any number of brilliant ideas and solutions, but as buyers and users that may have to use the technology for a number of years, we need to be careful.

The Gartner hype cycle is a popular way of looking at different technology and says that they tend to pass through five phases:

  1. A new technology is created.
  2. We expect too much from it.
  3. We’re disappointed when it doesn’t meet those expectations.
  4. We learn and change and figure out how to use it properly.
  5. It helps to be more productive up to a point, and then the effects level off.

It’s a nice graph, but there is little evidence to say that is actually works or has any science behind it.

It’s more a picture of how industry insiders collectively think about technologies at a point in time than an accurate reflection of the journey technologies take from creation to mass adoption.

A more useful indicator, used widely in academia, is the idea of Technology Readiness Levels or TRLs.

TRLs originated in the aviation industry, where pre-flight checks are common before taking off – a process called flight readiness reviews.

Having a checklist to go through and check and double check critical elements is a major contributor to flight safety.

NASA took this one step further, and came up with the idea of checking whether technologies were ready to start being used in programmes – a technology readiness review.

This led to the idea of readiness levels – and a formal version of these are used by many organisations.

For those of us that need to make a decision about a specific technology option, the picture above shows an adapted version of the TRL framework that may be useful.

In essence, we go from low TRL levels, where a technology progresses from basic principles to a model that works in the laboratory between levels 1 and 4.

At the other end, at 9, we have systems that are proven, work in the field and are probably widely deployed – but that are also mature and perhaps need changing

The interesting stuff is happening between 5 and 8, and this is where we should focus our attention.

Take blockchain technologies, for instance.

The idea of the blockchain and demonstrators with code have been around for a while.

Bitcoin, arguably the first proper prototype that began operating on the web in anger, has been around for nearly a decade.

We are now in a situation where there are a number of prototypes being operated – we can create apps on ethereum now and test them out – but there are still challenges that need to be solved around scaling and power usage.

So, we might score blockchain a 7 with strong potential to go onto 8.

That might suggest that a good time to get involved is right now.

How can we make better decisions in organisations?

decision-process.png

Is the quality of decisions made in organisations any better now than it was fifty years ago?

We have quicker, faster, better technology – but human nature and the way in which we think and act is still unchanged.

Which makes a working paper on Management Information Systems from 1971 by Anthony Gorry and Michal Morton an interesting read.

They use a framework for thinking about the kinds of decisions managers have to do.

Managers have to collect information and make decisions at three levels:

  1. Strategic planning: Choices about the future, done in a non-routine and often creative way.
  2. Management control: Getting the best out of people.
  3. Operational control: Making sure tasks are done effectively and efficiently.

Information for strategic planning is outward looking, taking into account market conditions, regulation and what competitors are doing – but is only required when the planning activity is taking place.

Management control is about people – selecting them, keeping them and motivating them.

Operational control is inward looking, focused on what is happening right now – and the information needed to support this is obtained and looked at on a frequent basis.

So, the obvious step is to think that the better the information that we have, the better our decisions will be.

That is the one of the touted benefits of Big Data, Machine Learning and AI – if we get all the data and crunch it, the information that comes out will help us make better decisions, or make them for us.

If we think about a decision process as a black box, with information going in and decisions coming out, surely we can improve the quality of decisions at all three levels by improving the quality of information?

But there are two things we miss.

The first is that different kinds of decisions need different types of information.

Merely collecting all the data that is out there is not the answer – and we know that from nature and biology.

We often think that we see a lot of things around us. In reality, our eyes can only see in a fairly narrow band, focusing on the thing that they are pointing at.

Our brain fills in the rest of the information, so it looks to us like we are seeing a wider scene.

Instead of more data, biological systems focus on a subset of data that is important for the specific situation.

The second thing is that we can also work on improving the decision process, and this starts by recognising that the problems we apply our decision process to can be structured or unstructured.

If a problem is structured – like working out the optimal size of a batch or the most economic schedule – we can collect the relevant data, analyse it, make a decision and monitor its impact using ongoing real-time data.

Many problems however are unstructured or “wicked”.

These can’t be solved simply by throwing more data at clever algorithms.

Instead they need better decision processes – better models that can express the complexity of real world affairs.

This requires us to use human intelligence alongside machine learning and artificial intelligence.

The computers are there to support us – not think for us.

Not yet anyway.

How to analyse the future

analysing-the-future.png

Thinking about the future is not easy.

As humans we fall prey to biases, and two in particular are important.

The first is hindsight bias where, looking back, we think that things that have happened were far more inevitable than they actually were.

For example a Trump victory seems like it was pre-ordained now – Hillary never stood a chance against the Twitter machine.

At the time, however, not many around the world seriously thought Trump would win.

The second is foresight bias – we believe some things are more likely to happen than others and so bet on them more heavily.

We need tools and methods to guard against these biases and reason about the future more effectively – and the military and intelligence establishments are a good source of information on these.

For example, this guide sets out a detailed approach to counterfactual reasoning, one of the tools every analyst should be able to use.

When we think about the future we often do one of two things.

1. We look at trends

We see trends and infer outcomes that result from those trends – a technique called forecasting.

For example, we might see a trend towards decentralised currencies with bitcoin or a trend towards widescale adoption of solar photovoltaic and distributed generation.

We forecast an outcome based on these trends – the end of traditional banking or energy firms.

2. We create possible futures

We do futuring when we look at drivers and come up with possible scenarios that might result.

For example, the widespread use of mobile phones will make desktop or offline services less relevant for things like getting media, checking mail and reading the news.

Counterfactual reasoning

Counterfactual means counter to the facts, and we reason that way by asking questions like “What if” or “If we”.

We can look at a problem in terms of antecedents and precedents – or before and after a fact.

Approaching a problem in this way has two benefits – it helps us explore cause and effects and it lets us be more creative.

For example, take a statement like the fall in the price of solar panels means that we will have widespread adoption in residential neighbourhoods.

That seems like a perfectly reasonable statement – but what happens if we break it down?

Should we start a solar panels sales business right now?

The before bit is a fall in the price of solar panels – which we see happening right now.

Cheap solar panels clearly lead to cheaper costs for the equipment.

But, does that alone justify the conclusion about what comes after – widespread adoption in residential neighbourhoods?

It does not – because we haven’t looked at the components in detail.

First, we need to examine why prices are low. Is it because the technology is getting better and cheaper, or is it because massive capacity increases in China are resulting in panels being dumped on the world market?

Then we need to think about the in-between – what may happen if what we predict takes place.

Low prices for panels don’t get around other problems – such as the connection constraints in neighbourhood, the other costs of installation such as scaffolding, and the possibility that high demand for installations coupled with low numbers of qualified tradespeople after BREXIT may result in bumping up the costs overall.

Then there is the after – new homes are very likely to have panels fitted – they can be designed in.

But will there be a rush by homeowners to retrofit panels or will they be put off by the up front cost and possible impact on sale prices?

If existing homes are slow to change, the overall rate of change will be slow because existing housing stock stays in place for decades so for everything to be replaced with new energy-efficient housing could take a century.

Summary

We can jump very quickly from what we see now to what we think will happen in the future.

The purpose of using analytic methods in a structured way is to help slow us down and examine the situation in more detail, coming to a more considered view on what may happen.

The conclusions we come to as a result may help us make better decisions.

What we should do before investing in technology

technology-impact.png

We often think of technology as a good thing – surely having the latest version of something is obviously the best way and people who do that win?

Perhaps not.

Charlie Munger said – The great lesson in microeconomics is to discriminate between when technology is going to help you and when it’s going to kill you.

Most companies would benefit from new production technology that is more efficient and so uses less energy.

The deciding factor, however, is what that technology does for the business

Does it help it create more products, for example.

In a commodity business, being able to push more product out means that the market has more supply and so prices go down.

The cost and energy savings made by the more efficient technology is wiped out by the reduction in prices to customers.

All of the benefit goes the customer, with little staying with the manufacturer.

The Japanese are well-known for having slow upgrade cycles, using older equipment for much longer.

This is because changing things adds complexity and could reduce the amount of time the factory actually operates.

In addition, changes often introduce new problems, and Japanese companies value stability and continuity.

They invest in systems that help them reduce defects, by continually monitoring a number of parameters and warning them when things are going wrong.

This helps them maintain quality.

Having good monitoring systems lets workers manage more systems and machines each – while good working practices, maintenance regimes and stable technology let operations carry on without crisis or constant intervention.

All too often, we look for a silver bullet – a new technology solution that will solve all our problems.

We should start, however, by making sure that we are using what we already have well – and good monitoring systems are our eyes and ears into the operations.

It’s simple really – we need to do the basic things a little better, every day.

And that starts with looking and improving what is in place before buying something new.

What type of service model do you have?

types-of-service-models.png

The UK economy is dominated by the service sector, which makes up more than 80% of GDP.

Many industrialised countries are in a similar position, moving away from raw material extraction and manufacturing to an economy based on service and, increasingly, knowledge based activities.

How should we think about service businesses?

We often start by thinking of a service as something people do for other people but this doesn’t capture the full picture.

In 1978 Dan R.E. Thomas, writing in the Harvard Business Review, suggested that we need to ask two questions to understand the model used in a given service business:

  1. How is the service rendered?
  2. What equipment or people render the service?

Matching services with business models

Although the article is old, it can be adapted into a framework to help match services with business models.

On one axis, we can think of people and their skills, ranging from relatively unskilled to professionals with extensive qualifications.

On the other, we set out how they use equipment and whether it needs to be operated, monitored or can be automated.

Services that require a human operator range from mowing a lawn, which can be done by someone relatively unskilled with a mower, to heart surgery, which requires a team of professionals with specialised equipment and facilities.

Monitored services can range from overseeing equipment, such as a car wash to more complex plant operations and consulting services.

In these situations the people don’t need to get physically involved but use systems to keep track of operations and change settings as needed.

Automated services range from vending machines at one extreme that have a fairly straightforward task of dispensing products to expert systems such as a health website that allows us to diagnose ourselves and decide whether we need to go to a hospital or not.

Why knowing the kind of service model you have is important

The kind of service model we operate decides how we scale the business.

If a business depends on one person’s time to succeed, then scale can only happen by adding more similar people.

Think lawyers, accountants and management consultants.

There is a reason why most professional practices are small.

They can only grow by putting in more capital and pushing up their fixed costs base which, if revenue fails to grow as expected, means they eventually slide into failure.

There aren’t that many ways to get around this. A common solution is to find patrons – small or big.

Scaling equipment, on the other hand, may be an easier option.

As more of the service is automated, the same number of professionals can deliver a better service to customers.

Unless it spills over into self-service.

There is a crucial difference between service automation that makes things better and cheaper for users and service automation that makes things better and cheaper for providers.

Getting users to do more of the work can easily fall into the latter category.

The right blend of service and equipment

A good service business, it would seem, has a core of people with appropriate skills and scales by adding technology and automation that improves service quality to customers before adding more people.

As with most things, that’s easy to say, but not simple to do.

How to create the conditions for complex outcomes

elephant-more-than-sum-of-parts.png

The natural world is teeming with creatures perfectly adapted to their environment – that have ways of walking, swimming and flying, live alone or in social groups and participate in an ecosystem with their own unique niche and capabilities?

Where do we begin trying to understand how they do it?

We start by breaking things down into parts that we can understand.

Like blind people touching parts of an elephant, we find pieces – a snake-like tail, a fan-like ear, a tree-like leg.

If we bolted a snake, a log and a fan together with the other bits that we identified, would we get an elephant?

The answer is clearly no – but we persist in trying to build complicated things from simpler pieces.

Take most systems, for example.

An organisation is a system made up of people in roles.

There are some at the top who see themselves as the brains and controllers of the outfit and many people who do work.

Organisations are often designed – made up of structures and hierarchies and reporting lines – held together and moved in a particular direction by incentives, punishments and guidance.

Does organisational behaviour come from the particular arrangement and positioning of people?

Or does it emerge from somewhere else?

The study of emergence looks at how complex behaviour arises from the interaction between simpler elements.

There is a difference between complex and complicated.

Complicated may be something like a steam train – with lots of moving parts. When the parts move in the way they should, we get something complicated like a moving train.

An example of a complex thing is a flock of birds flying in the sky together. Each bird maintains its distance from another – and the whole flock can swoop and move like a single living thing – but there is no one bird that plans or controls the action.

The complex thing that we can relate to easily is the Internet.

We are all connected by a vast decentralised network that has only a few simple rules about pages and links – but is so much more than that now.

Emergence is sometimes seen as the border between order and chaos.

In an ordered world, everything has its place – we put a rock on top of another rock and eventually we can get a building.

A chaotic world is dynamic – as elements combine randomly with feedback to create new conditions that – and range from the weather to swirls in a coffee mug.

As we move from order to chaos – we pass through emergence – and that is where life and the behaviour we see in the natural world seems to be.

But how can we use this in daily life or business?

With knowledge work in particular, a strict rules based approach is unlikely to create anything particularly interesting or innovative.

Instead, its the interaction between people with capabilities working together that creates output from the organisation that is “greater than the sum of its parts”.

Managers should try and do just a few things.

  1. Find good people.
  2. Remove as many barriers as possible that stop them working together.
  3. Set a few working practices
  4. Get out of their way.

Then, wait to see what emerges.

What kind of approach is best for a new project?

big-vs-small.png

What is a good model to use when setting out on a new project or venture?

Is it to design for size from the very beginning – to plan for scale and explosive growth?

Or is it better to start small and build on little victories?

The answer, as in most cases, will be it depends.

The approach we take is contingent on the situation – what the environment around us looks like, what capabilities we have, the resources we can muster and what moves other players are making.

The challenge is that we don’t know what works.

If we look around at examples of what has worked, we see survivors – firms, systems and people that dominate the economy.

That doesn’t mean that how they did it was the right way – it means that the way they did it was right for their time and they were lucky.

It also doesn’t mean that they will continue to survive.

Size brings with it problems – the dinosaurs were perfectly adapted to their conditions until the conditions changed, and they couldn’t change quickly enough.

Viruses, on the other hand, may have been around since the dawn of life – and continue to spread and replicate themselves.

A often quoted post talks about this in the context of software design.

A good software solution needs to be simple, correct, consistent and complete.

The right way to design it to solve a problem completely, implement it on the right platform, use the right tools and maintain it in the right way.

Or we can get half of it working and available, get people using it, get them hooked and then worry about making it better.

Keeping it simple is the most important thing. It needs to be correct as far as we can see. Consistency and completeness are nice to have, but they can be sacrificed in the interests of keeping thing simple.

In addition, the fewer things we have, the less effort it is to be consistent or complete.

For many of us, then, it comes down to a personal world view.

Some of us will be comfortable with the idea of a large project, a big plan and the will to go with the big win.

Others will prefer small, even austere approaches.

In an ecosystem – there is place for both types of creatures.

It is the same with markets.

Why we need to get tactile with data

obeya-tactile-data.png

We often put a lot of effort into creating a good looking dashboard or reporting system – but then what happens?

All too often it simply becomes background noise.

We get it every day and ignore or simply tune out – going blind to it while we get on with whatever is latest and loudest.

We tend to fall into patterns and things like data and information displays can simply become pretty pictures rather than being used for reflection and action.

Unless you work in a lean organisation, that is.

The Japanese have a word for a big room – Obeya – that they use to call a dedicated space that is where people come together, can see what is going on and collaborate.

A way to think about this is like a command centre, a war room or the bridge of a ship.

Japanese companies like Toyota use this every day – or even several times a day.

It starts with a simple idea – we have to hit certain targets every day.

We get together during the day and go through the numbers and see if we are on track or not.

If not, we can make changes and correct our course. Being in the same space helps with having that conversation.

The space doesn’t have to be physical – it can be a digital space where we can get together, share and modify information.

But the important bit is that we need to engage with information we get.

At Toyota they make updating information a manual activity – writing numbers by hand, drawing charts and updating status indicators.

It’s the process of interacting with the data and information we have in front of us – of trying to touch and feel it – that transforms it from being a pretty picture on the wall to the source of our next action.

We are more engaged when we understand what is in front of us – and that makes for better conversations and more useful collaboration between colleagues.

It’s interesting that as we have more and more powerful ways to dissect and distill the data around us we humans become the bottlenecks in being able to use the information and insights more effectively.

And that’s no bad thing – constraints are good for innovation.

If anything – we need to slow down even more.

We need to look beyond the dashboard as a result and focus on the end result – what are we trying to achieve each day?

We should get our fancy algorithms and computers to do the number crunching they are good at and give us the figures we need – that’s not work people should do.

Our job to use our time to get a feel for the numbers – getting tactile with them.

That frees us up to use our creative ability to come up with solutions – and we need all the creative time we can get.

Because there are a lot of interesting problems out there to solve.

How to solve real-world management problems

soft-systems-methodology-learning-cycle.png

We know we have to change things – but how?

A naive approach is to think that there is an engineering solution to everything.

Buy new software, change machinery, institute a new form or process and everything will fall into place and get better.

That approach assumes that business systems fit together like Lego blocks and swapping a new one in or moving them around will fix the problem.

It’s simply a question of knowing what systems we want.

We can then list out the options we have, model alternatives and then select the best one based on objective criteria – simple.

There’s just one problem.

The chances are that the people involved want different things.

The thing that the accountants see as an issue is different from how engineers would put the situation which is vastly different from the vision of the CEO and shareholders.

And, because its much easier to see things from our point of view, the decisions that get made say more about power and influence than impact and improvement.

Soft systems methodology (SSM), a programme of action research carried out by Professor Peter Checkland at Lancaster University, is an approach that helps us cut through such situations and have a structured debate about the problem situation and what we can do to improve it.

The principle that underlies SSM is that the one thing that we see in all real-world problems is that people are trying to take purposeful action.

Take carbon reductions, for example.

No one in any organisation these days would argue that it’s not better to be sustainable, reduce energy and emissions, and act in a more socially responsible way.

Why don’t we do more then?

The engineers blame the accountants for stopping projects.

The accountants point the finger at the CEO’s decision to limit costs.

The CEO points to the priorities of shareholders and the desperate need to meet quarterly numbers and support the stock price.

There are no solutions to such problem situations.

Instead, SSM teaches that there are accommodations – things we can do that reconcile conflicting interests.

It does not mean that everyone is satisfied – but it is a position that we can all come to that allows us to move forward and take action.

And that’s done through a structured learning cycle as shown in the figure.

We take a real-world situation, create models that describe a set of activities that enable purposeful action in that situation and compare them.

We use these models to talk to each other and see different points of view and figure out what accommodations we can make.

Then – we can take action to improve the situation.

But it doesn’t end there. This is a learning cycle – which means we can go around the loop forever, or at least as long as we’re still in business.

And it’s more complex – because we still need to think about culture and politics – that adds more layers to our analysis.

The thing is that real-life problems that involve people, their opinions and time aren’t simple to solve.

Let’s not pretend that they are – then we might start to make some real progress.