Tuesday, 6.54pm
Sheffield, U.K.
It’s easy to assume the world is the way it is and that’s how it’s going to stay.
It’s hard to imagine an alternative to the status quo. Can you imagine Google and Facebook not being as big and powerful as they are now? Doing a search on any other engine?
Logically – it’s possible, even likely. Societies change, regimes fall and companies disappear. All the time.
But, when you’re in the middle of a situation, whether personal, business or political, it’s hard to see where the change is going to come from.
Which is where power theory may help.
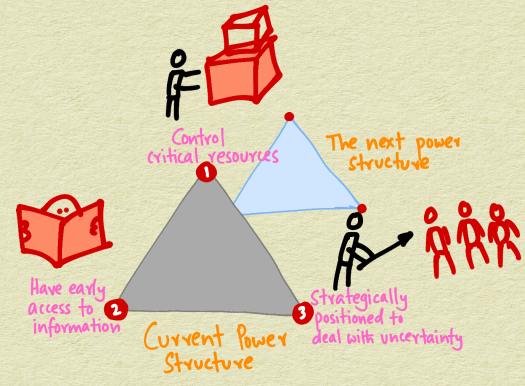
This paper by Oliver E. Williamson says that you need to have three things to grab power in an organisation:
- You need to control critical resources.
- You need to have early access to information.
- You need to be strategically positioned to deal with uncertainty.
Technically – he argues that the most critical part of the organisation will get these assigned to them. So, for example, if marketing is the bit of the organisation that makes the most difference, then it will be given these three things to do.
He also says that power theory is not great at explaining things – it’s a bit of a pied piper – because if you have control, why would you give it up? Why wouldn’t you stop power being taken away from you?
Now… I’m not sure I agree with his dismissal of the concept, because it seems to be useful in explaining both how things are and how they might change. Bear with me.
Let’s say you run a big car company in the US in fifties and sixties. The rest of the world has been devastated by war but the mainland US is unaffected and starts to churn out stuff for the rest of the world, supported by natural resources, a big population and abundant industrial expertise.
You’re in control. You make plenty of money. People buy your cars all around the world. Gas is cheap, so your cars are big and comfortable. You’ve got plenty of political support because of all the people you employ and the politicians you support.
You’ve also got all the statisticians and data analysts and government reports you need to see about the industry. Plenty of information on sales and resources and competitors. Nothing really gets past you.
You have a perfect power triangle – you’re in the strongest shape of your life – and it looks like nothing can ever challenge your dominance.
Until it does.
The Japanese car producers, who you’ve dismissed as makers of small, cheap, tinny cars that the American public will never buy, start to make better cars.
More importantly, however, there is a oil crisis. The Middle East creates a cartel and sends prices sky high. And suddenly all your big cars are hugely expensive to run, you don’t know how to make small economical cars and the Japanese have an opening – and people start to try their cars and like them.
Your problem is that you weren’t strategically positioned to deal with this kind of uncertainty.
And that’s because it’s really hard to predict such a dramatic shift in circumstances, especially when things are going so well.
Let’s take another example.
Microsoft was unchallenged in the PC operating system world. It ran most machines. The rest hardly made an impact.
The thing that they weren’t strategically positioned for was the Internet – and that let Google in.
What this shows us is that power is temporary – it’s a function of control, information and positioning.
At a point in time.
There’s no point in controlling critical resources if they become irrelevant. Just ask the coal industry as it wilts in the face of renewables.
There’s no point in having early access to information, for example through leaks from the government, when the Internet doesn’t give a hoot what politicians think and lets anyone talk to anyone else in the world.
And there’s no point being positioned behind a big wall if there’s a big tunnel forming right under it.
However fixed something seems to be, however powerful the current people in charge appear to be, there’s another power structure forming behind them, invisible to them – but getting ready to replace them.
Let’s hope it’s a better one.
Cheers,
Karthik